
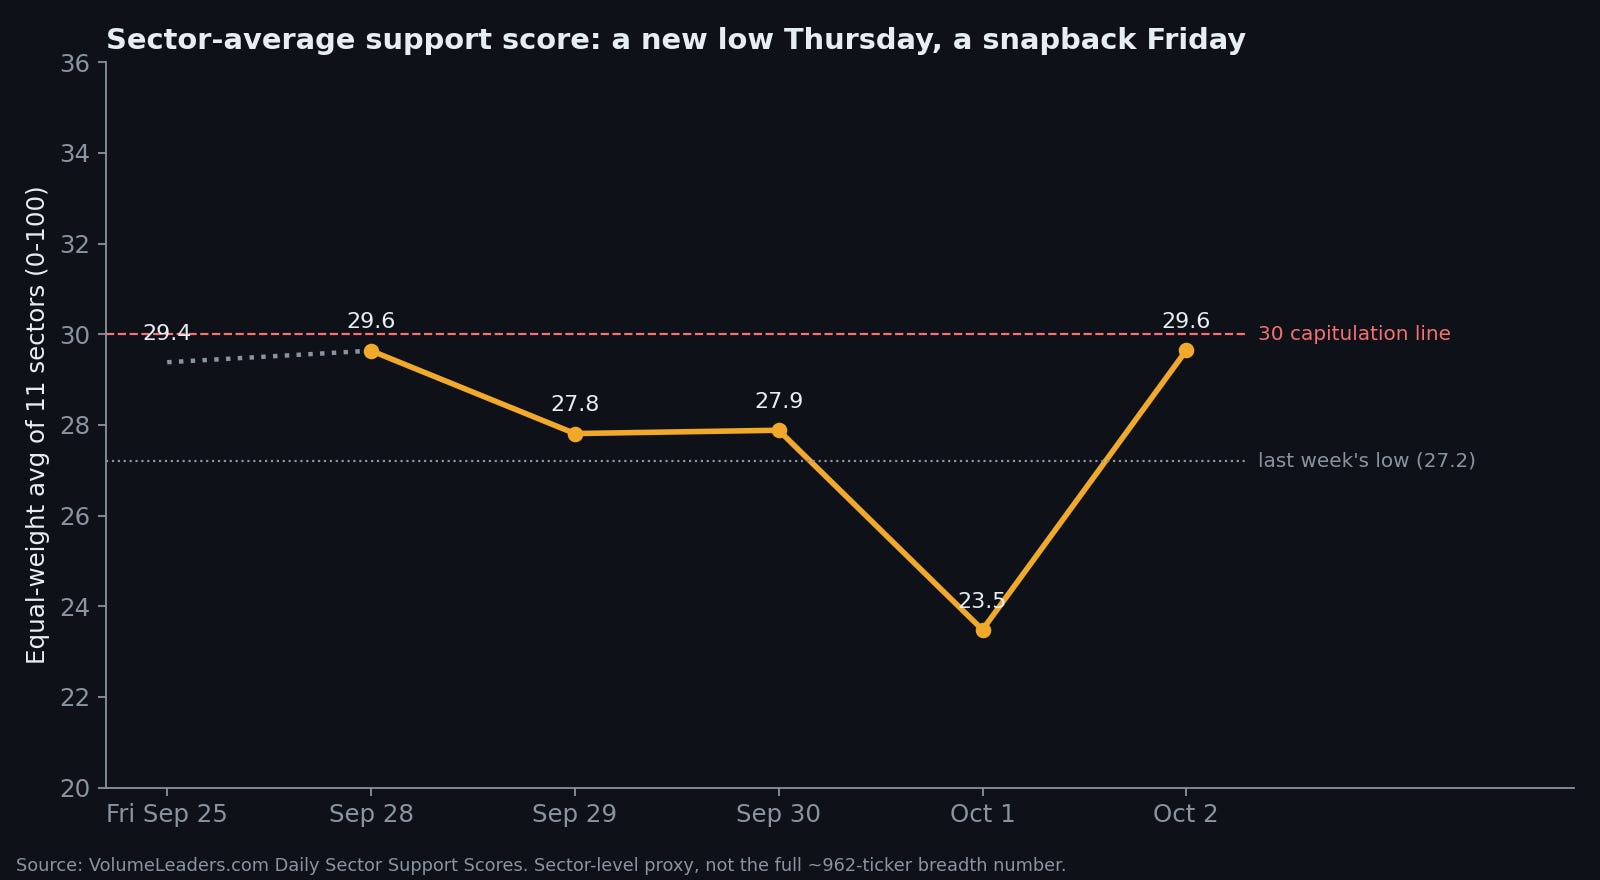
On Thursday, the sector-average support score closed at 23.5.
That’s a new low, nearly four points under last week’s 27.2, and the lowest reading since I started sharing these. On Friday it jumped 6.1 points in a single session, to 29.6. Net for the week: up 0.2. If you only looked at Friday to Friday, you’d think nothing happened.
The S&P 500 finished at 7722.72, down 0.27% on the week. The Dow fell 1.26%. The Nasdaq Composite rose 0.45%.
Scoring last week’s call
Last week I gave you two triggers to watch through Friday, October 2.
Trigger A: a new low below 27.2 on above-average volume. That would mean the crowd had finally shown up and we’d have a low we could take seriously on participation.
Trigger B: a close back above 33.9, with Technology still above 50. That would mean the quiet dip was over and nobody had bothered to panic.
The new low came, but the crowd didn’t. Thursday, the day the score hit 23.5, the board traded roughly $205 billion in notional institutional volume. The 30-day average is about $241 billion. So Thursday was a below-average day. The busiest day of the week was Wednesday, around $270 billion, when the score barely moved. Trigger A needed both halves, and it got one. Trigger B didn’t come close. The best close of the week was 29.6.
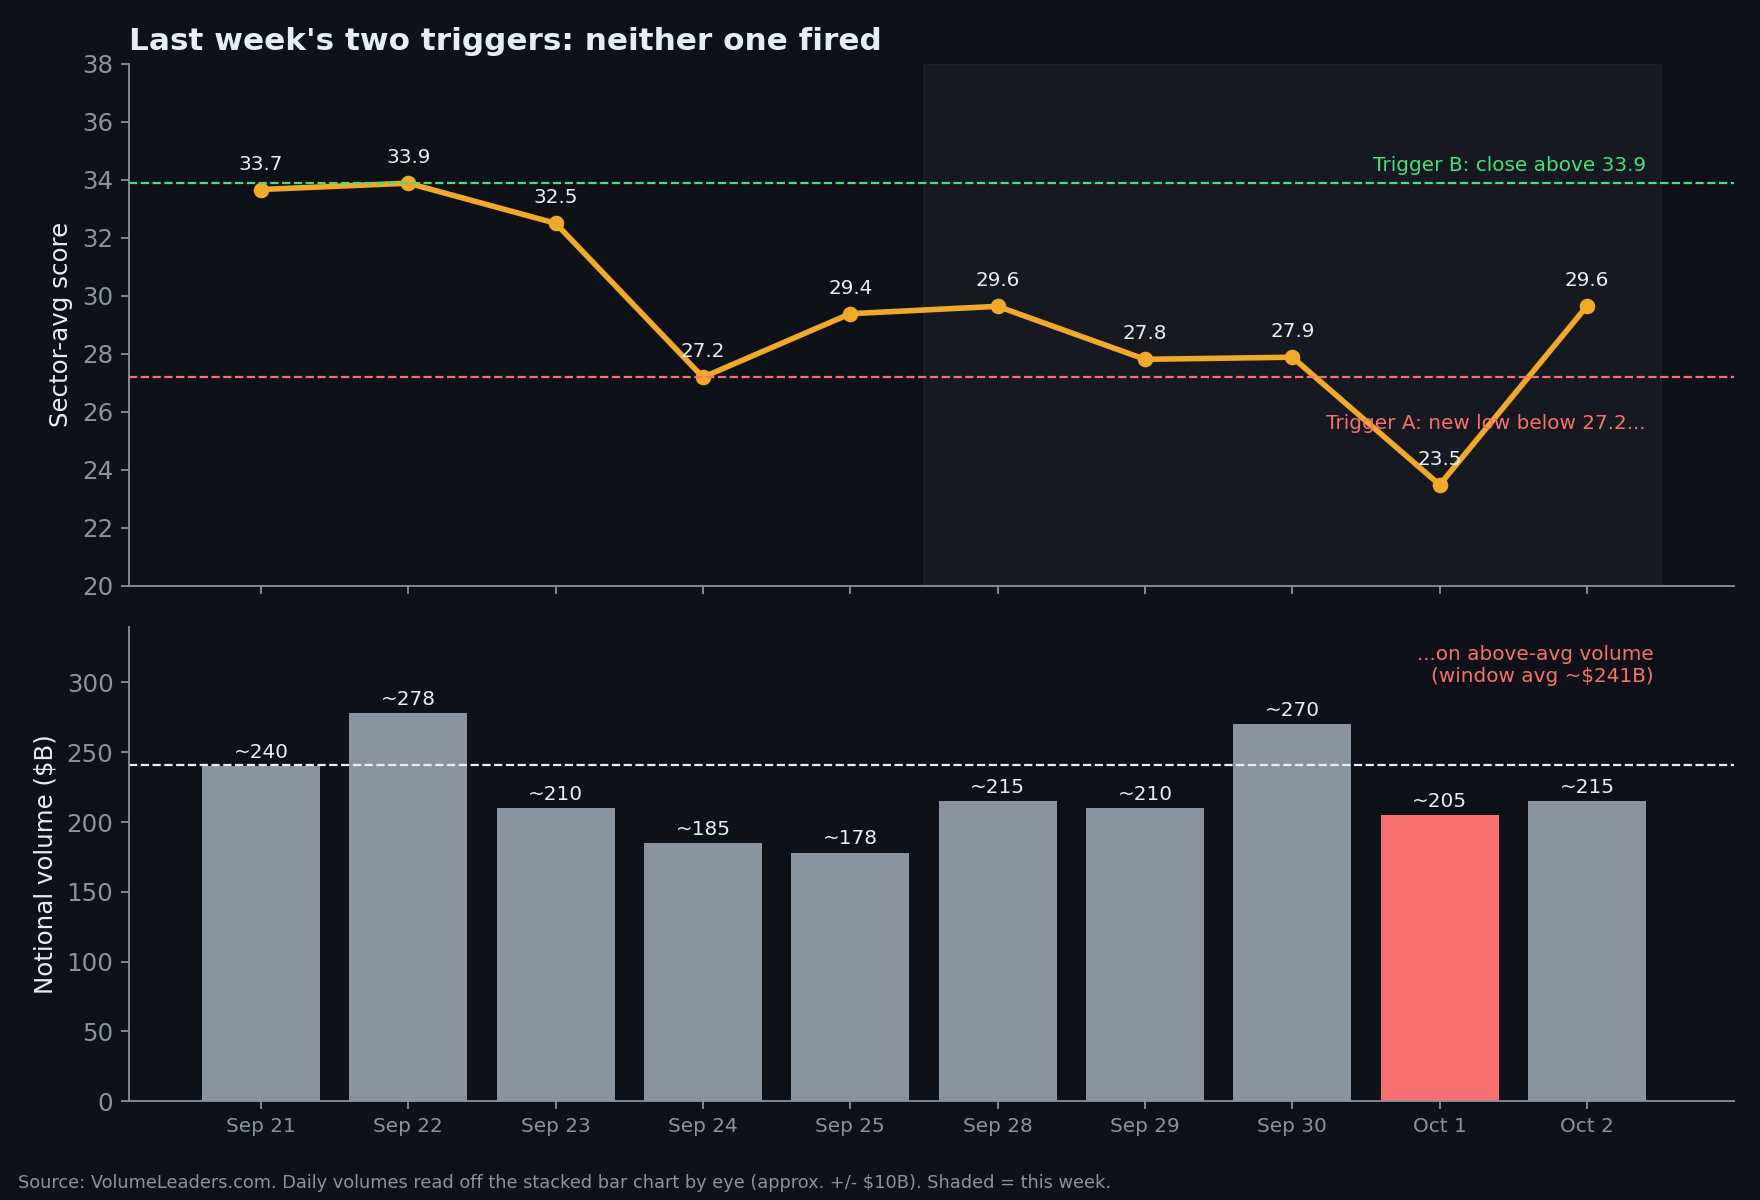
So neither fired, and I said that if neither fired I’d call it unresolved. Welp, it’s unresolved.
Most weeks, nothing decisive happens. The market doesn’t owe anyone a clean answer on a schedule, and the most useful thing a forecaster can do in a week like this is admit the question is still open, instead of quietly redefining the question until it has an answer.
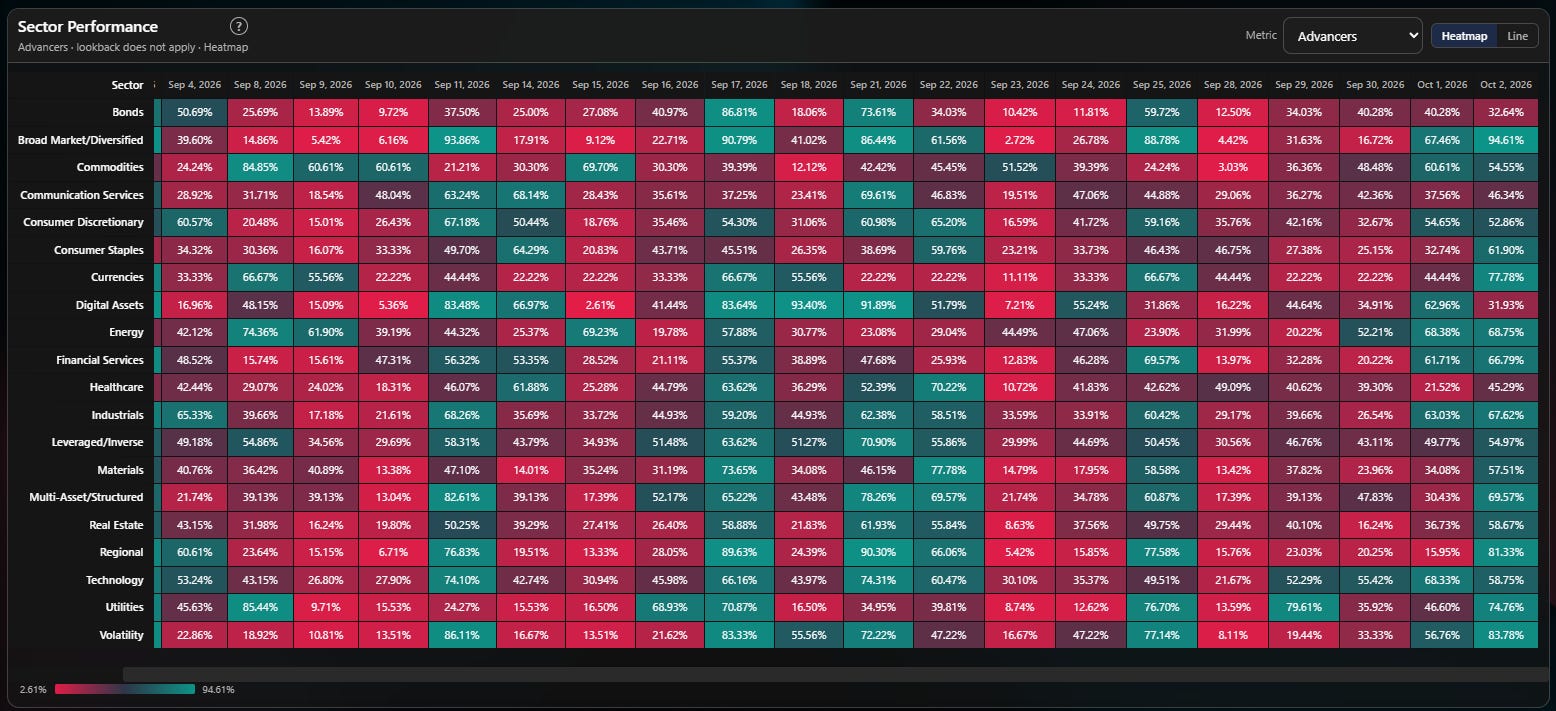
What I can say is which reading had the better week. Quiet erosion said the score would keep sliding without much fuss, and from Monday to Thursday it did exactly that: 29.6, 27.8, 27.9, 23.5, with no volume spike. The other reading, that the selling was mostly done, got its best evidence on Friday. That was the snapback, plus a very broad up day: 94.6% of the names in the dashboard’s advanced.
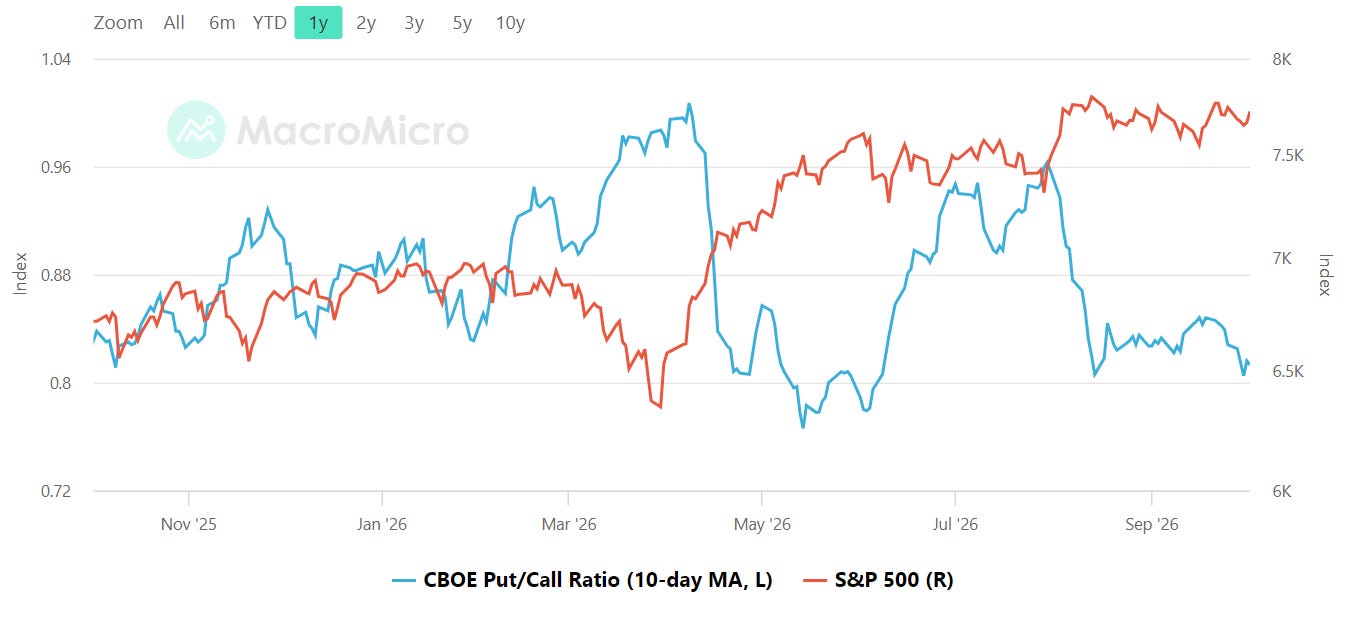
The fear gauges stayed calm through all of it. Put-call ratio was at 0.78 on Friday, down from about 0.90 on Thursday, at the lows. That’s elevated, but it’s nowhere near the spikes that mark real fear on the same chart.
What moved Friday
The jobs report.
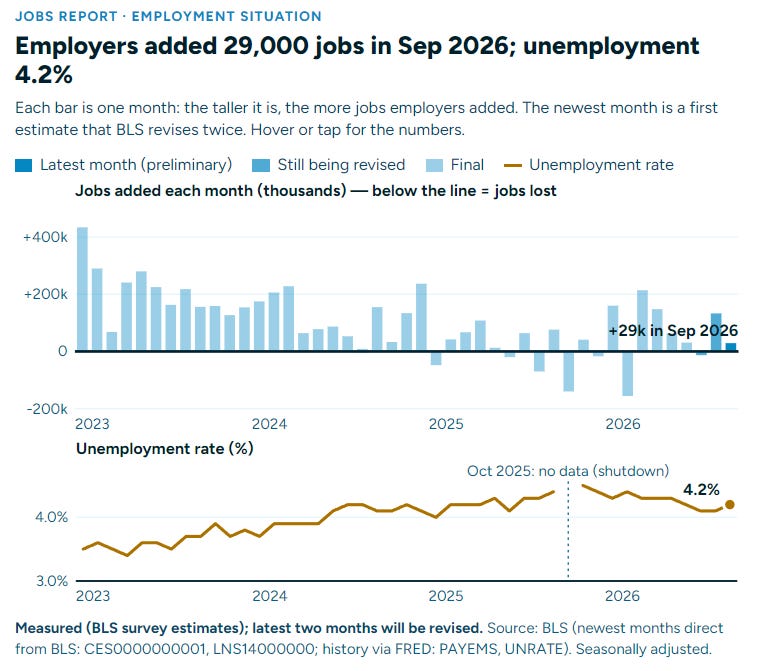
The economy added 29,000 jobs in September, against expectations of around 90,000. July and August were revised down by a combined 60,000. July now shows a loss. Unemployment ticked up to 4.2%. Treasury yields fell, the odds of another Fed hike in October dropped, and the S&P rose about 0.75% on the day. The labor market had a bad month and the stock market had a good Friday, which is the usual arrangement when what investors most want from the economy is for it to disappoint the Fed a little.
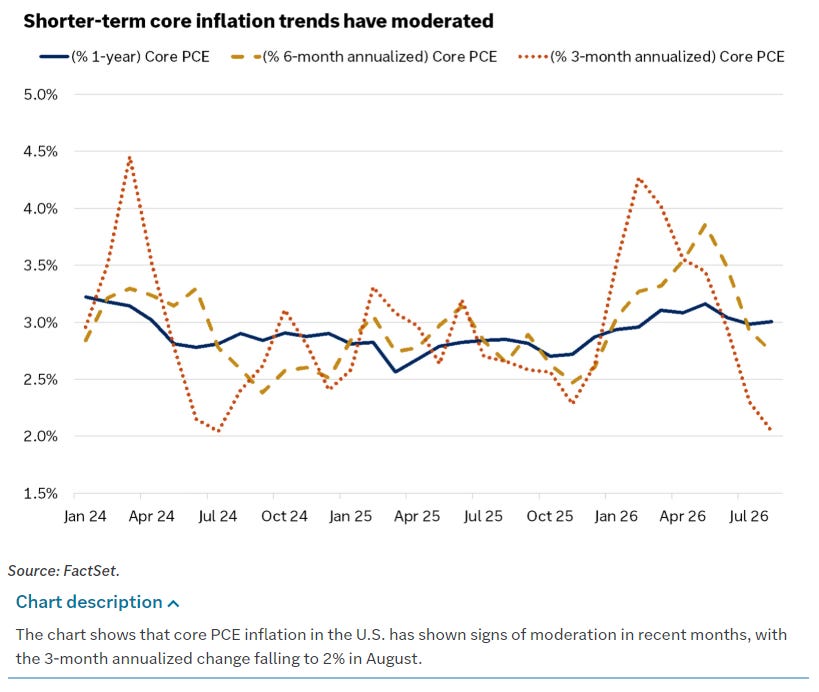
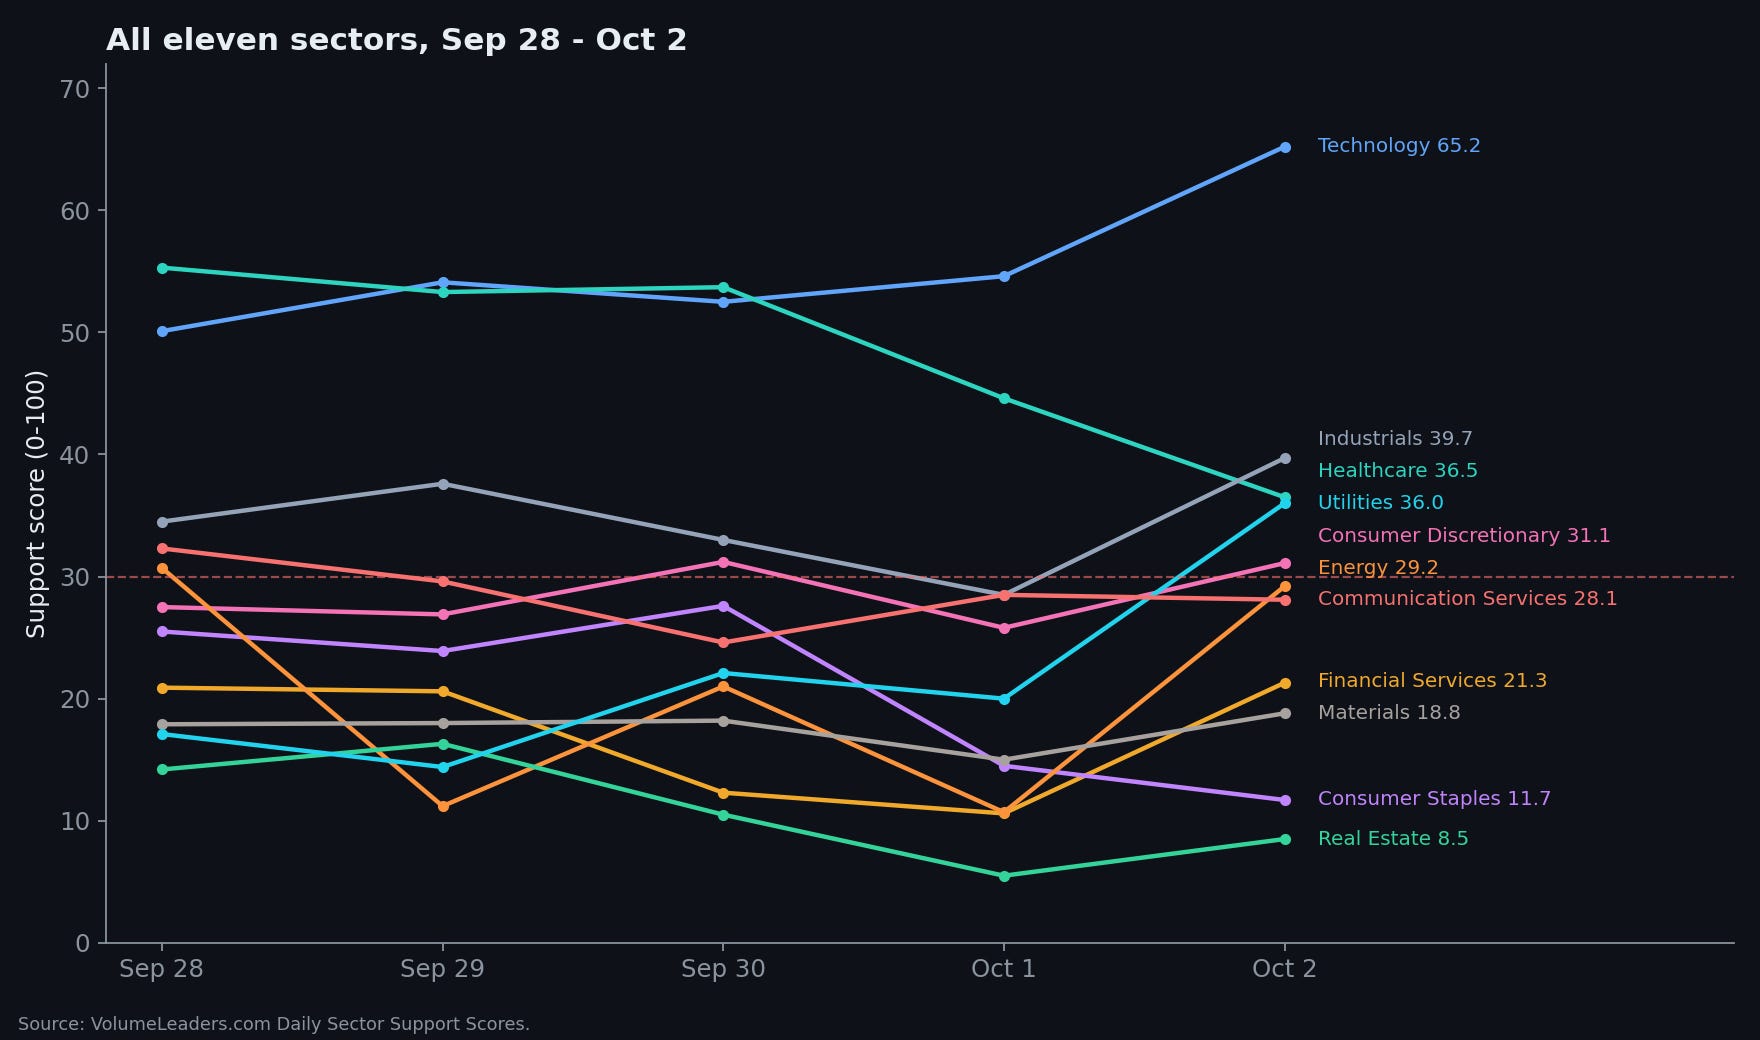
The board’s Friday moves read like a rates story. Utilities jumped 16 points in one day, from 20.0 to 36.0. Last week, I tied Utilities’ slide to the 10-year Treasury pushing past 5%, on the logic that a dividend has to work harder when bonds pay that much. This week, when yields eased, Utilities bounced hardest. That’s one week, but it’s the right direction for the explanation I leaned on. /10Y clawed back most of what it lost so this week’s action in Utilities could be telling.
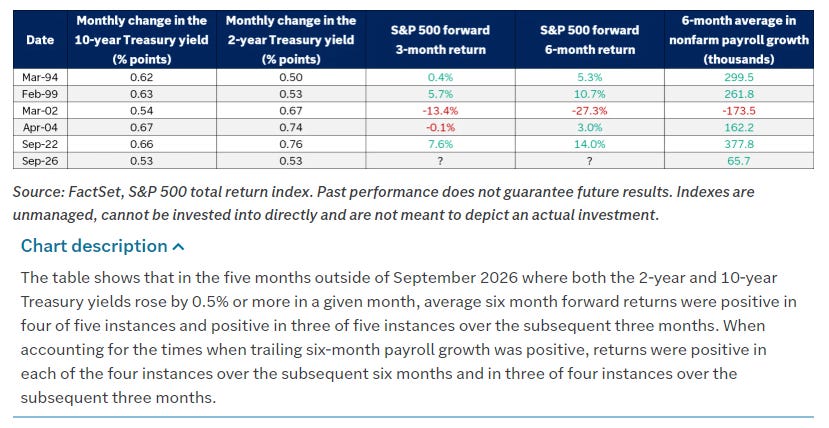
Financial Services is still the odd one. Last week I left it unexplained after it fell even though the yield curve steepened. This week it kept falling, to 10.6 on Thursday, then jumped 10.7 points on Friday as yields dropped. If anything, that’s a small hint that Financials are being hurt by high rates, perhaps through credit worries, rather than helped by a steeper curve. One day is not enough to call it, so it stays an open question.
One sector left above 50
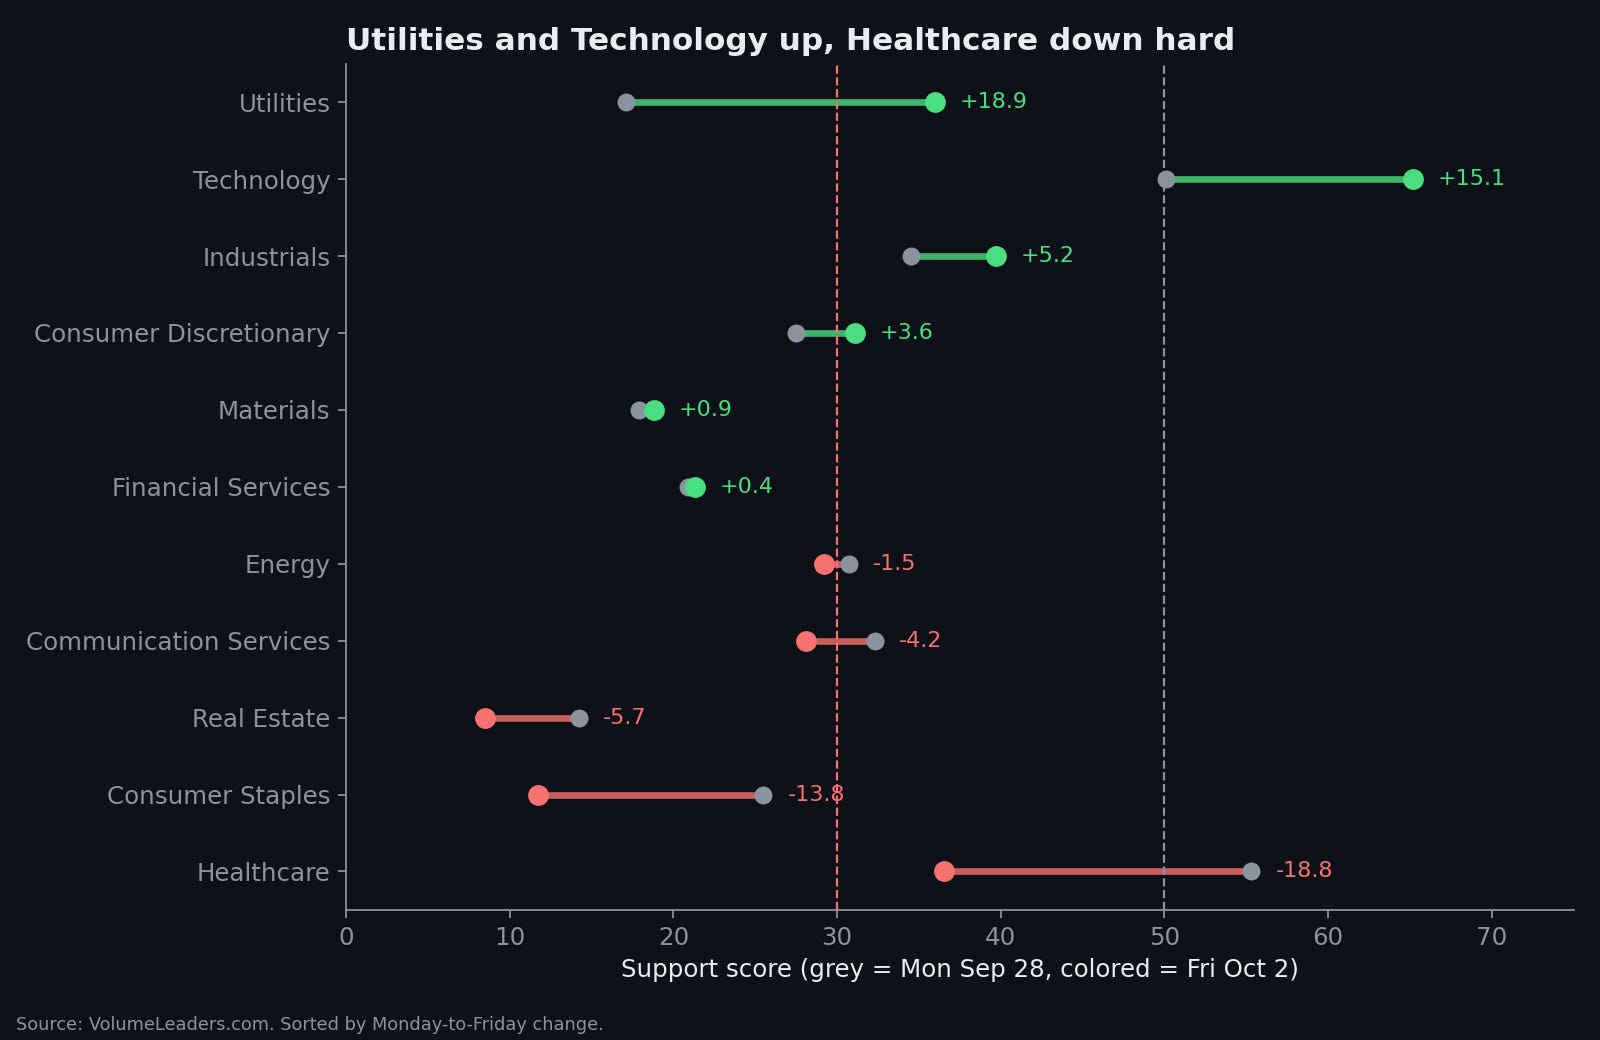
Last week, two sectors were holding the board up. This week it’s one.
Technology closed Friday at 65.2, its best reading in this stretch, and its box plot median is around 80. By the dashboard’s own sector returns, it was the only one of the eleven to finish the week in the green, up about 0.3%.
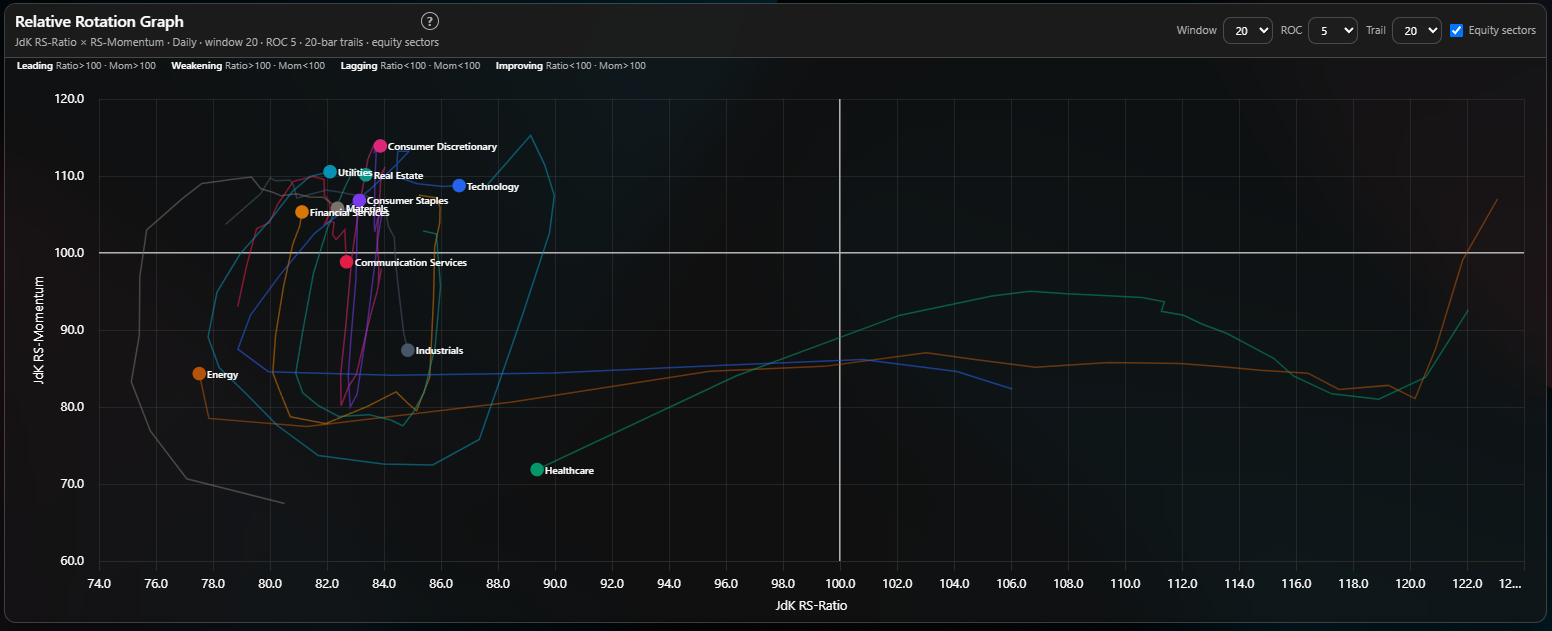
Healthcare went the other way. It started the week at 55.3 and finished at 36.5, down 18.8 points, the biggest drop on the board. The dashboard’s blended momentum reading for Healthcare, which had been positive every day since at least early September, turned negative on Thursday. On the relative rotation graph, Healthcare slid out of the right-hand side of the chart, where it had been alone last week. No sector sits on the right-hand side now. Consumer Staples fell 13.8 points, to 11.7, and Real Estate finished at 8.5.
At Friday’s close, the median stock in Consumer Staples and Real Estate had none of its ten biggest institutional volume levels of the last 30 days underneath it. Every one of them was overhead. (Guide to reading the Whisker Plots)
Under the hood: themes worth charting
Sector scores are useful, but they don’t tell you what to actually pull up on a chart. A sector average is like a school’s average test score. This week Healthcare’s average fell sharply, and one of its classrooms is still near the top of the whole school. A few things stand out.
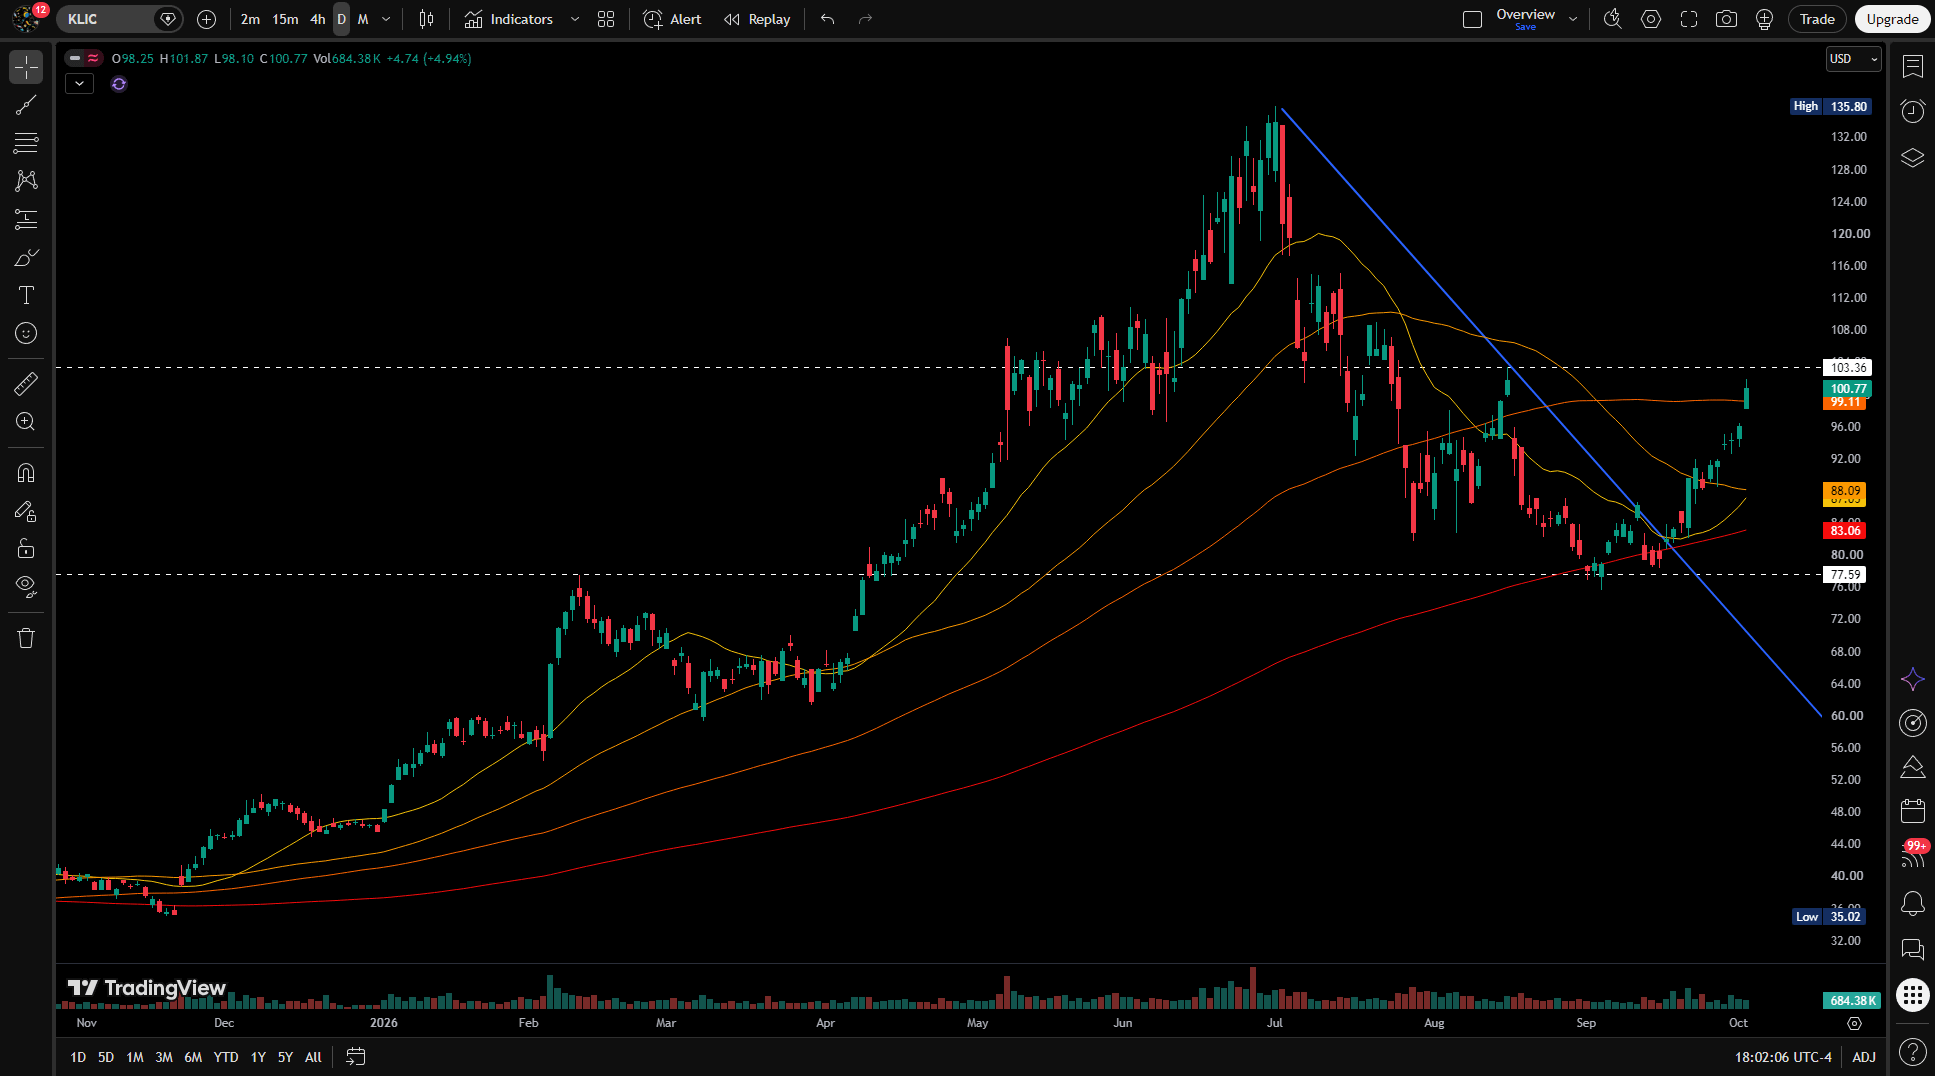
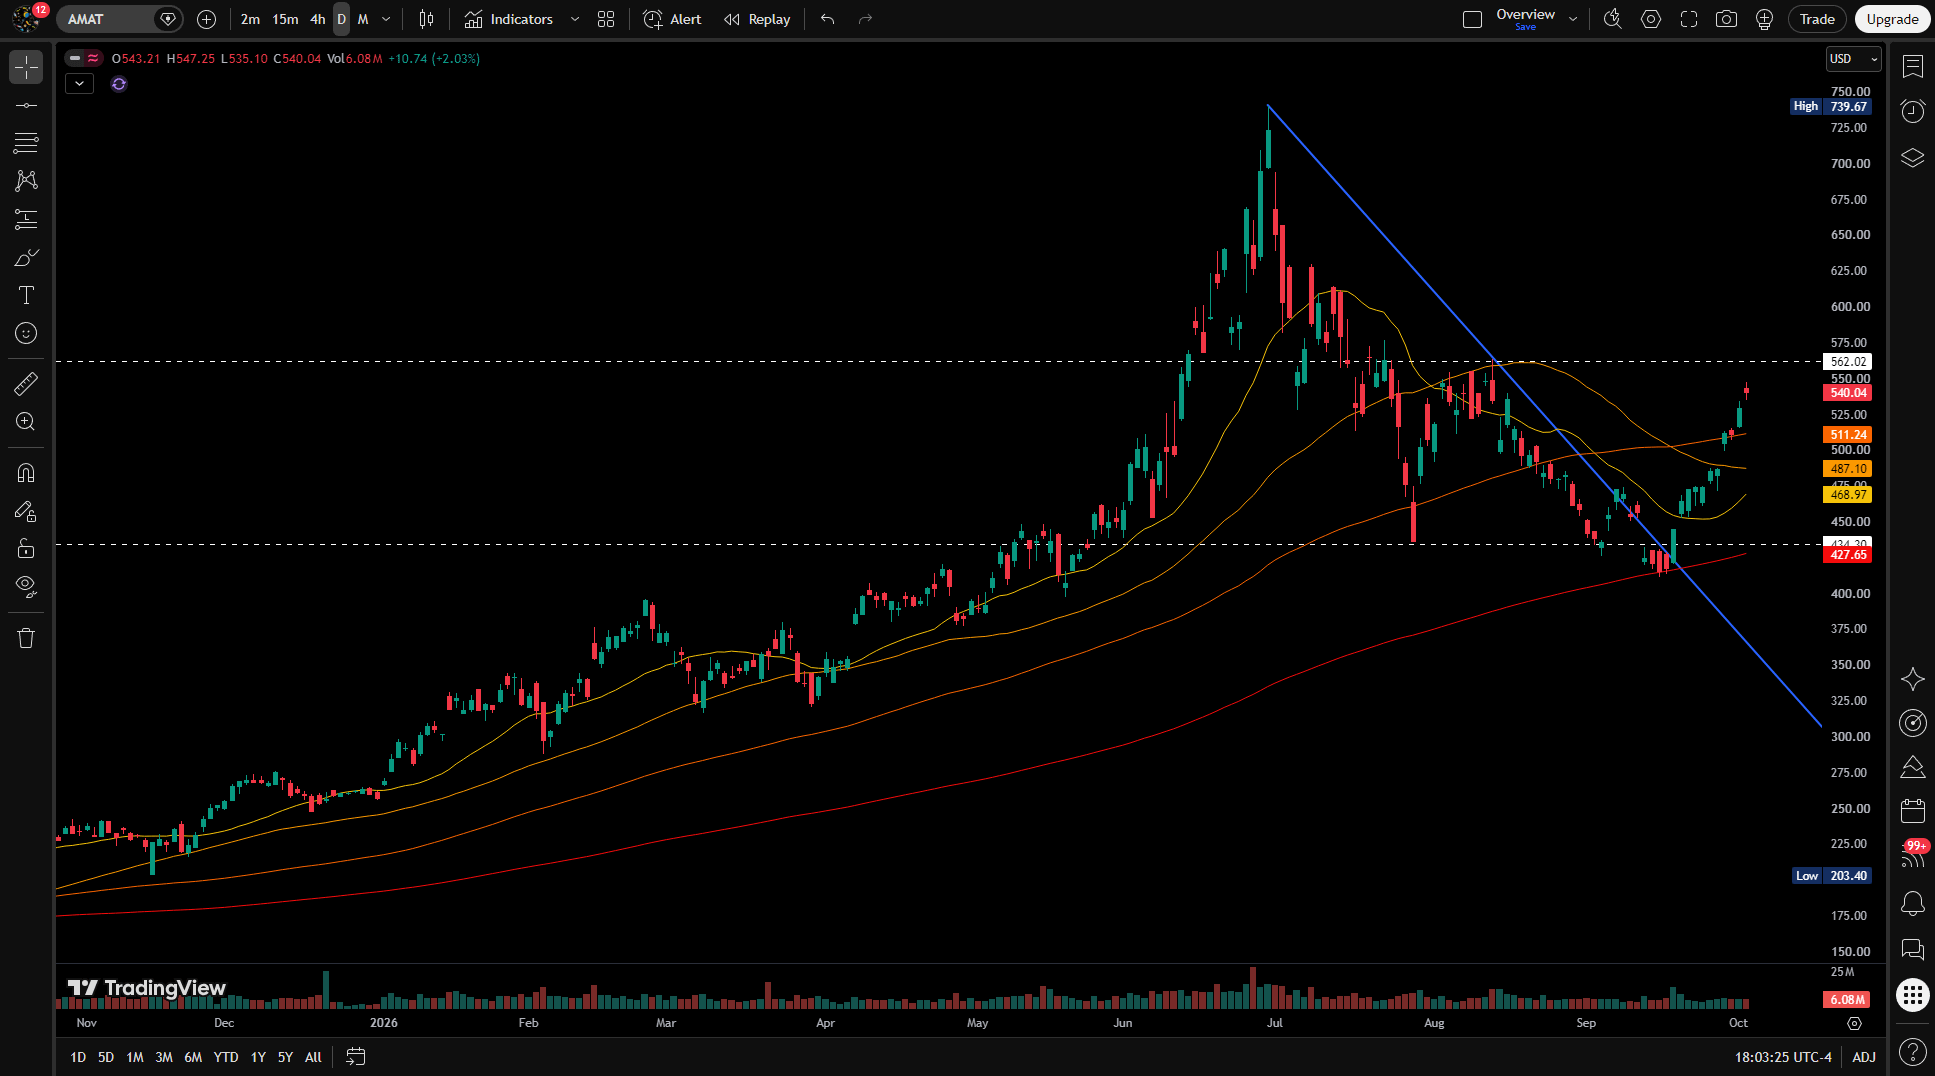
Technology dominates the top of the list. About three-quarters of the names in the top 25 themes are Technology stocks. That matches the sector score, but the themes tell you where inside Tech. It’s mostly the picks-and-shovels end of chipmaking: packaging, testing and the equipment that builds chips.
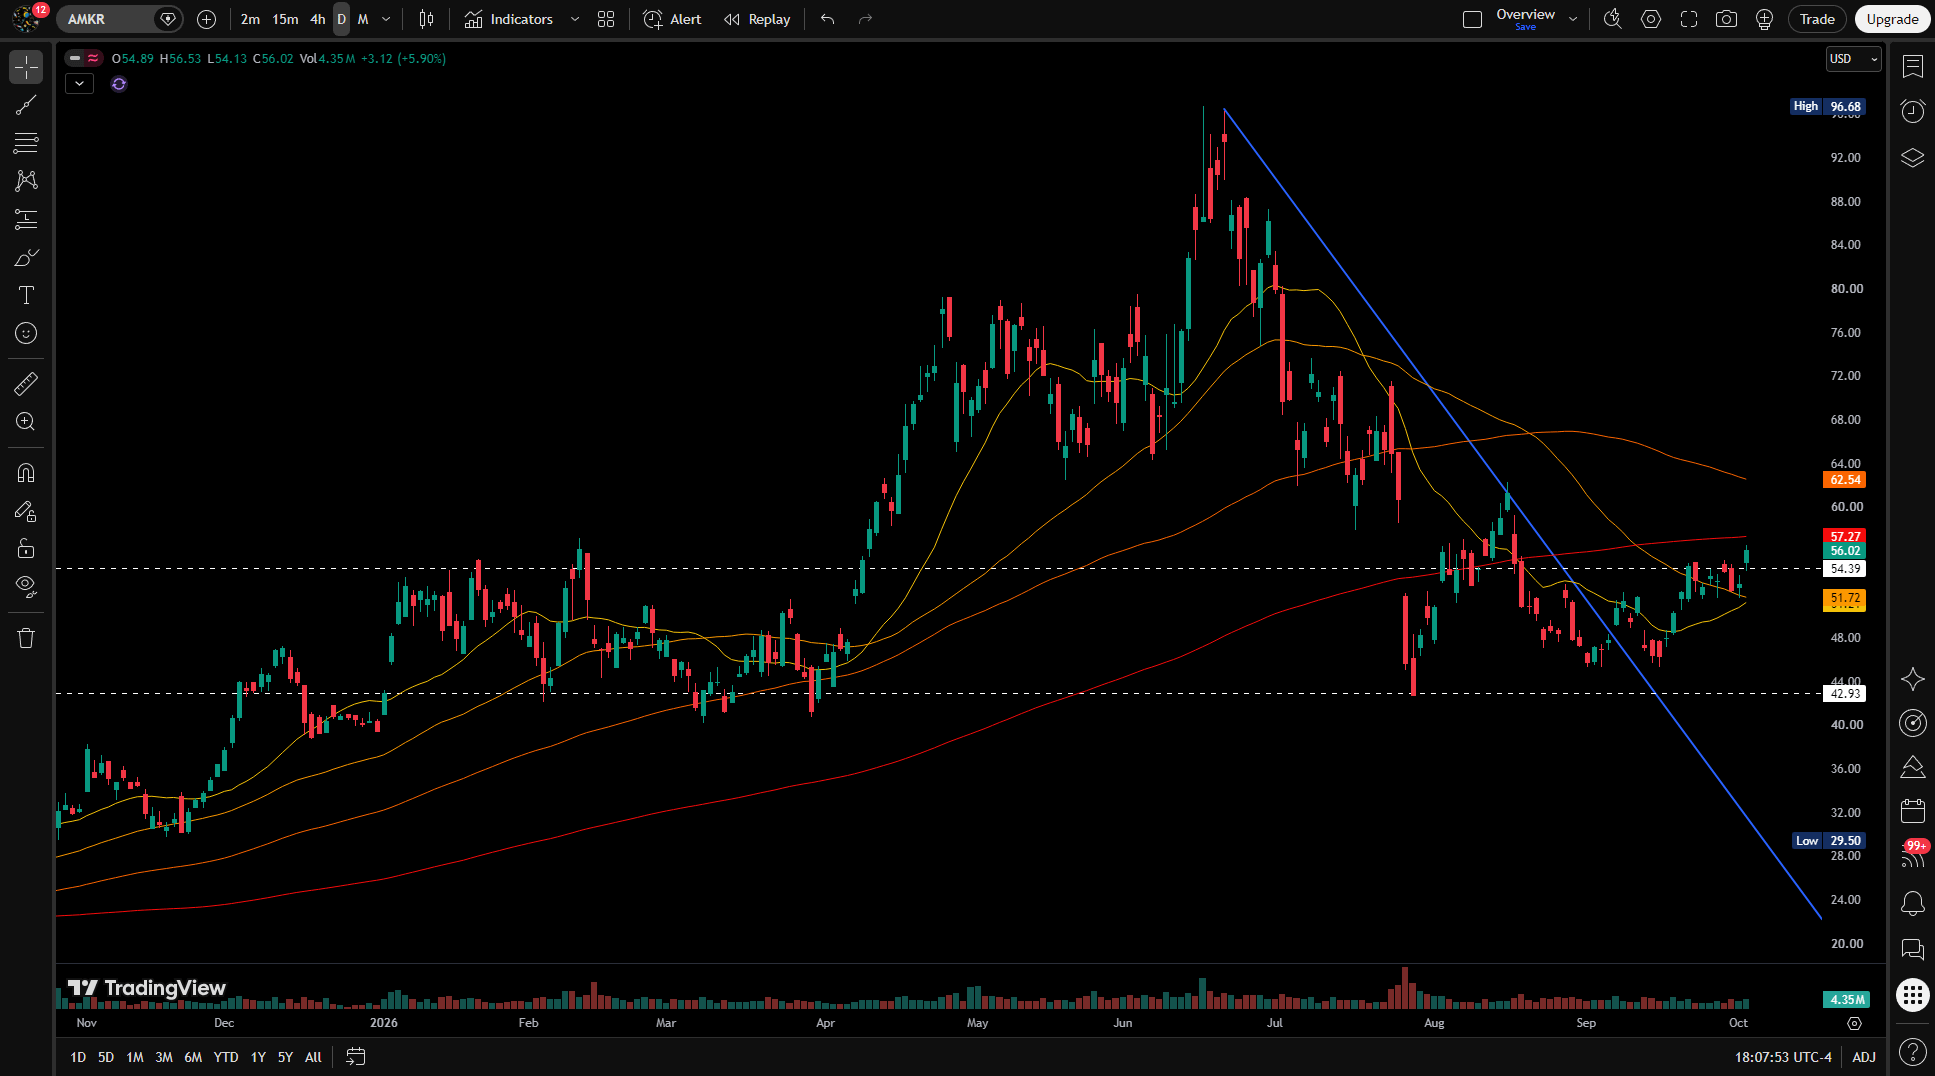
Semiconductor equipment and packaging. Advanced Packaging is the number one theme, and four of the top twelve are chip-equipment themes. Names to chart:
KLIC
AMAT
LRCX
KLAC
ASML

ENTG
AMKR
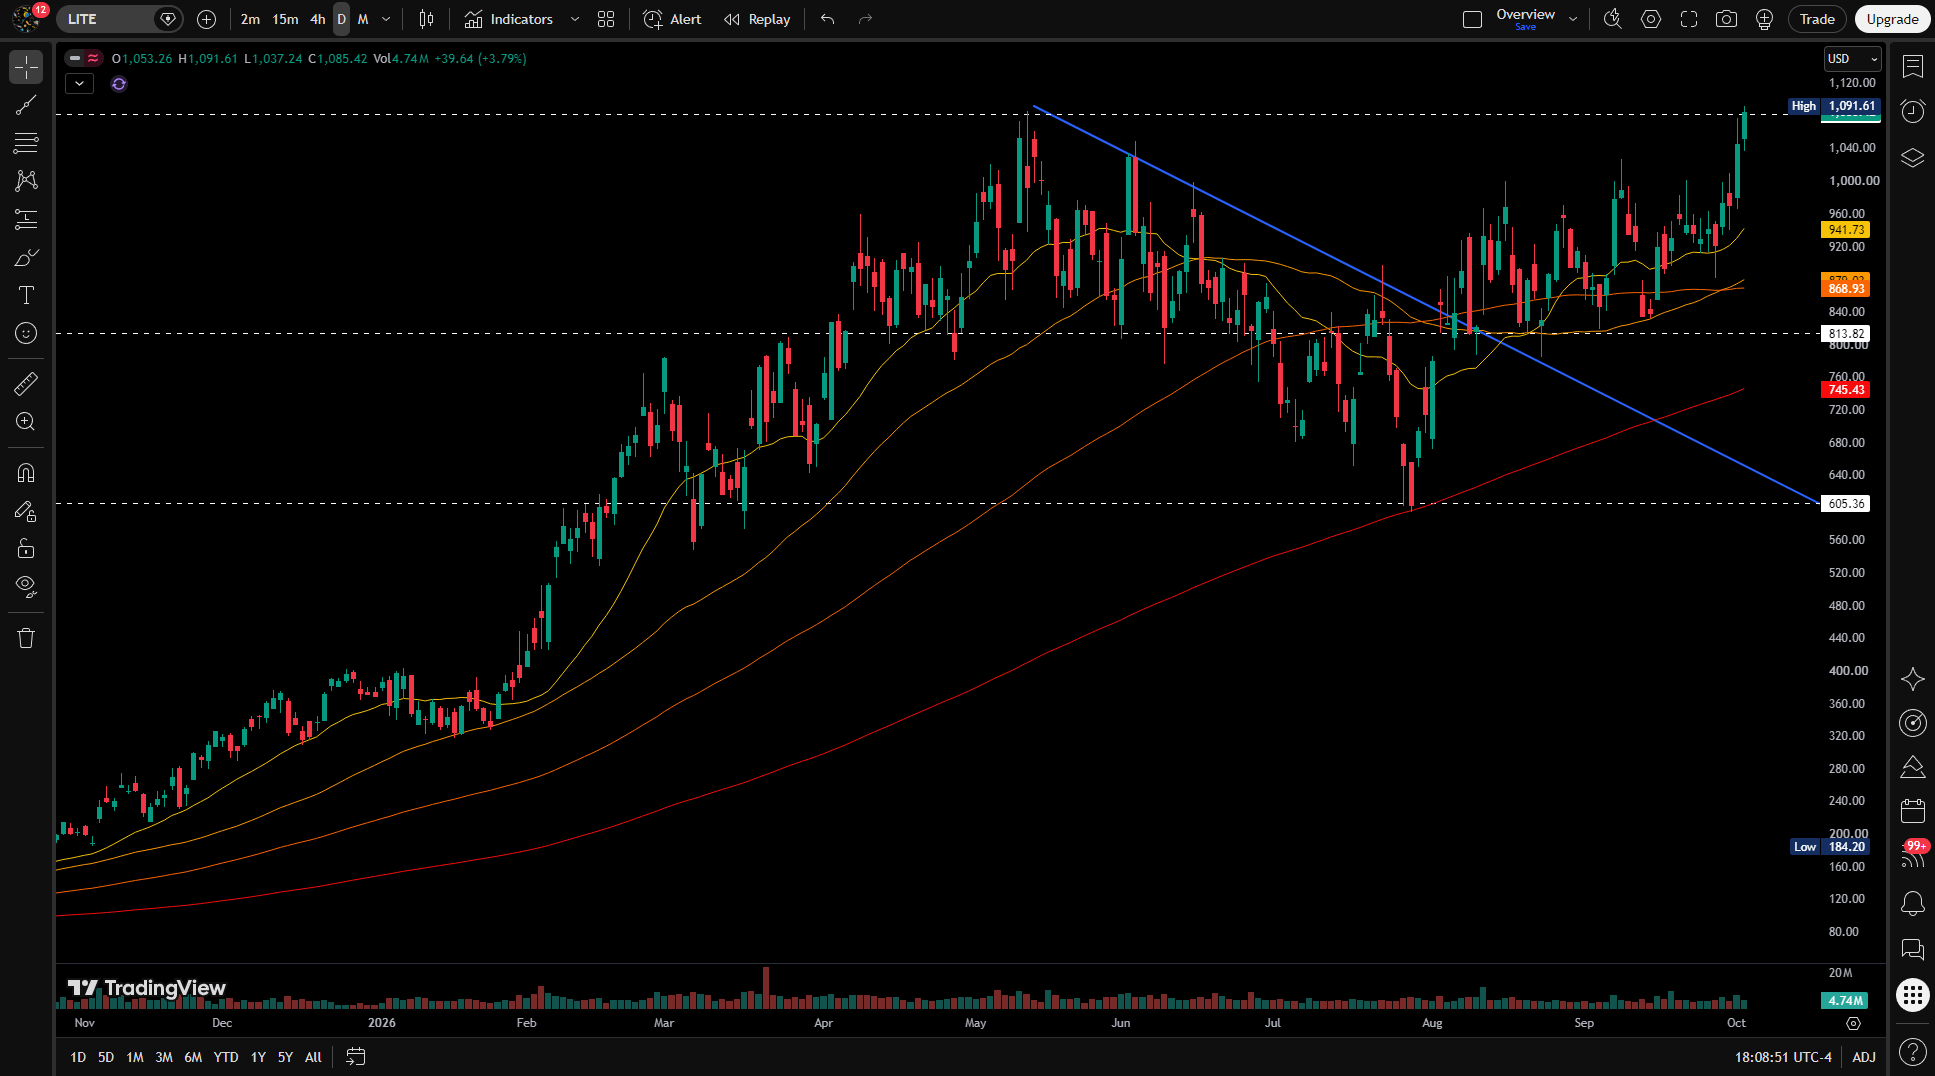
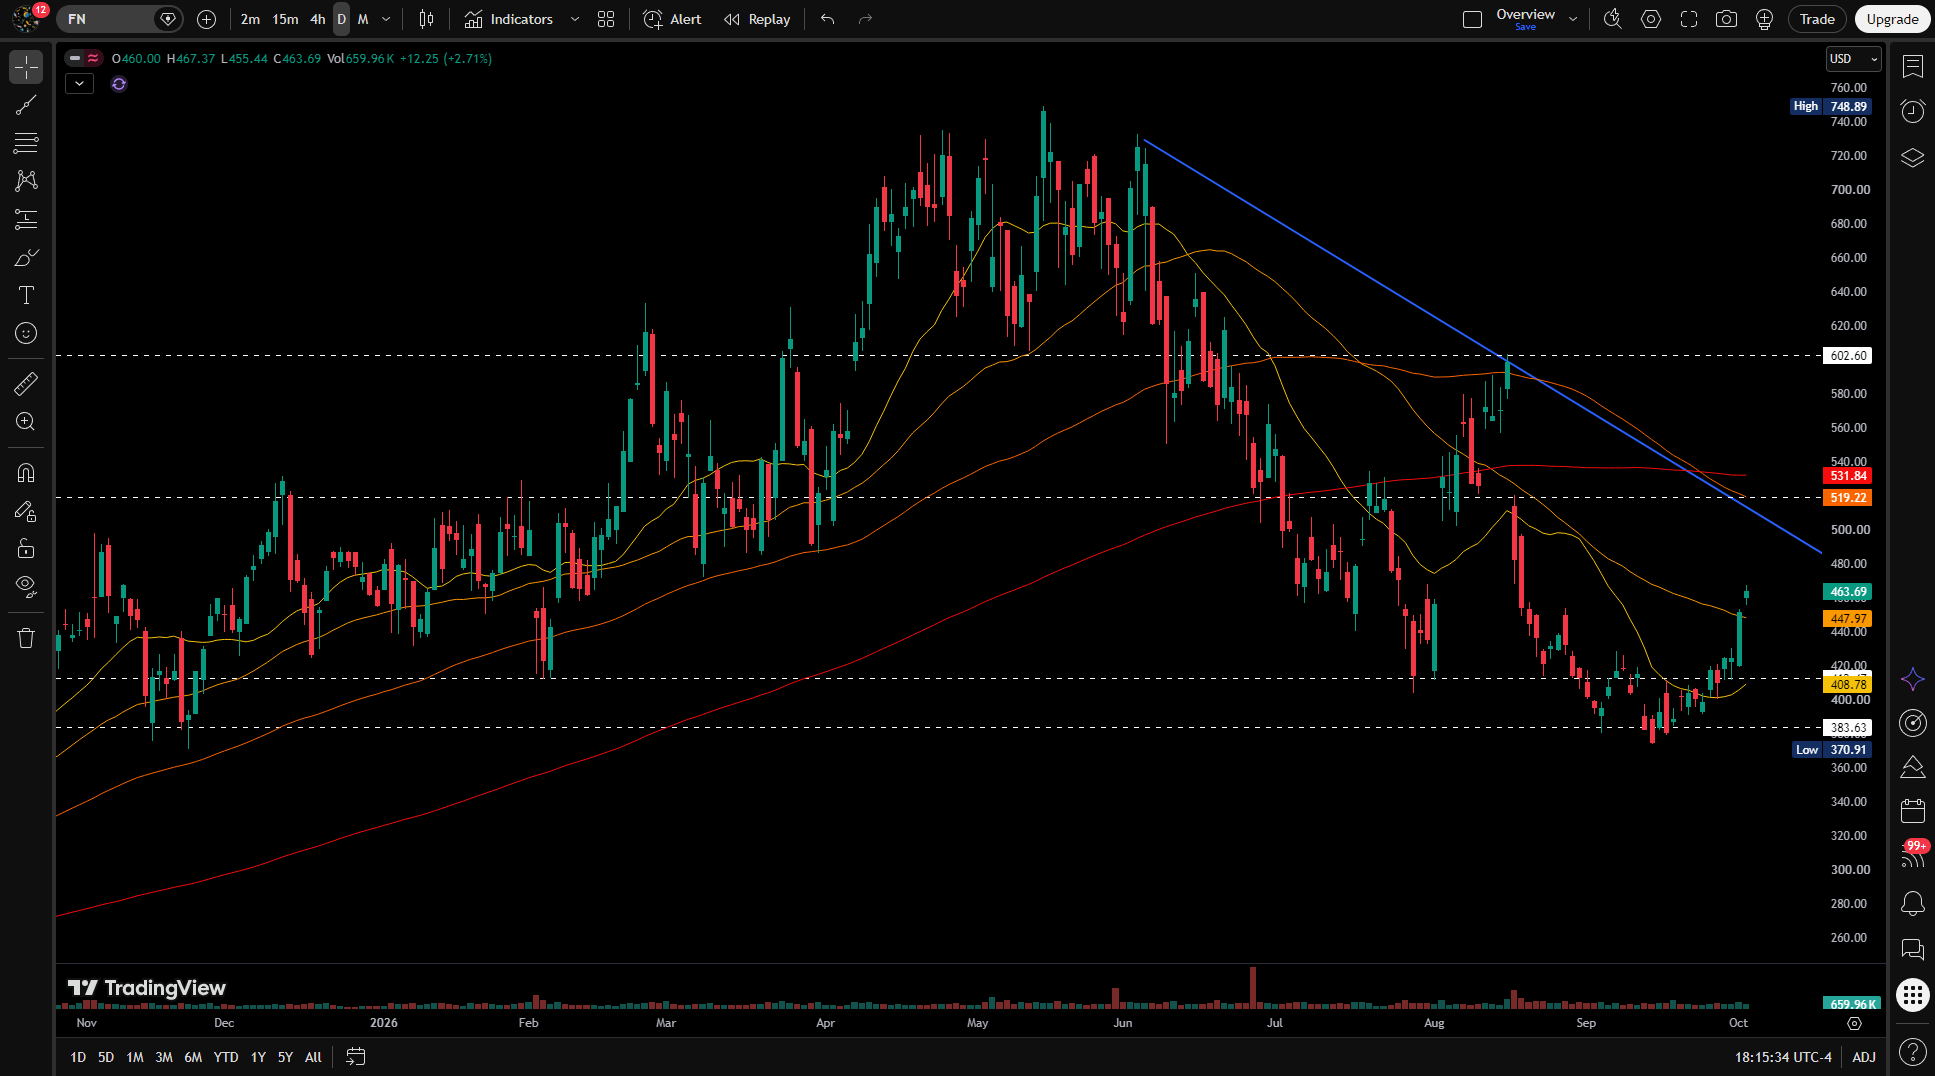
Optical networking and photonics, the 16th and 24th themes. Names to chart: LITE

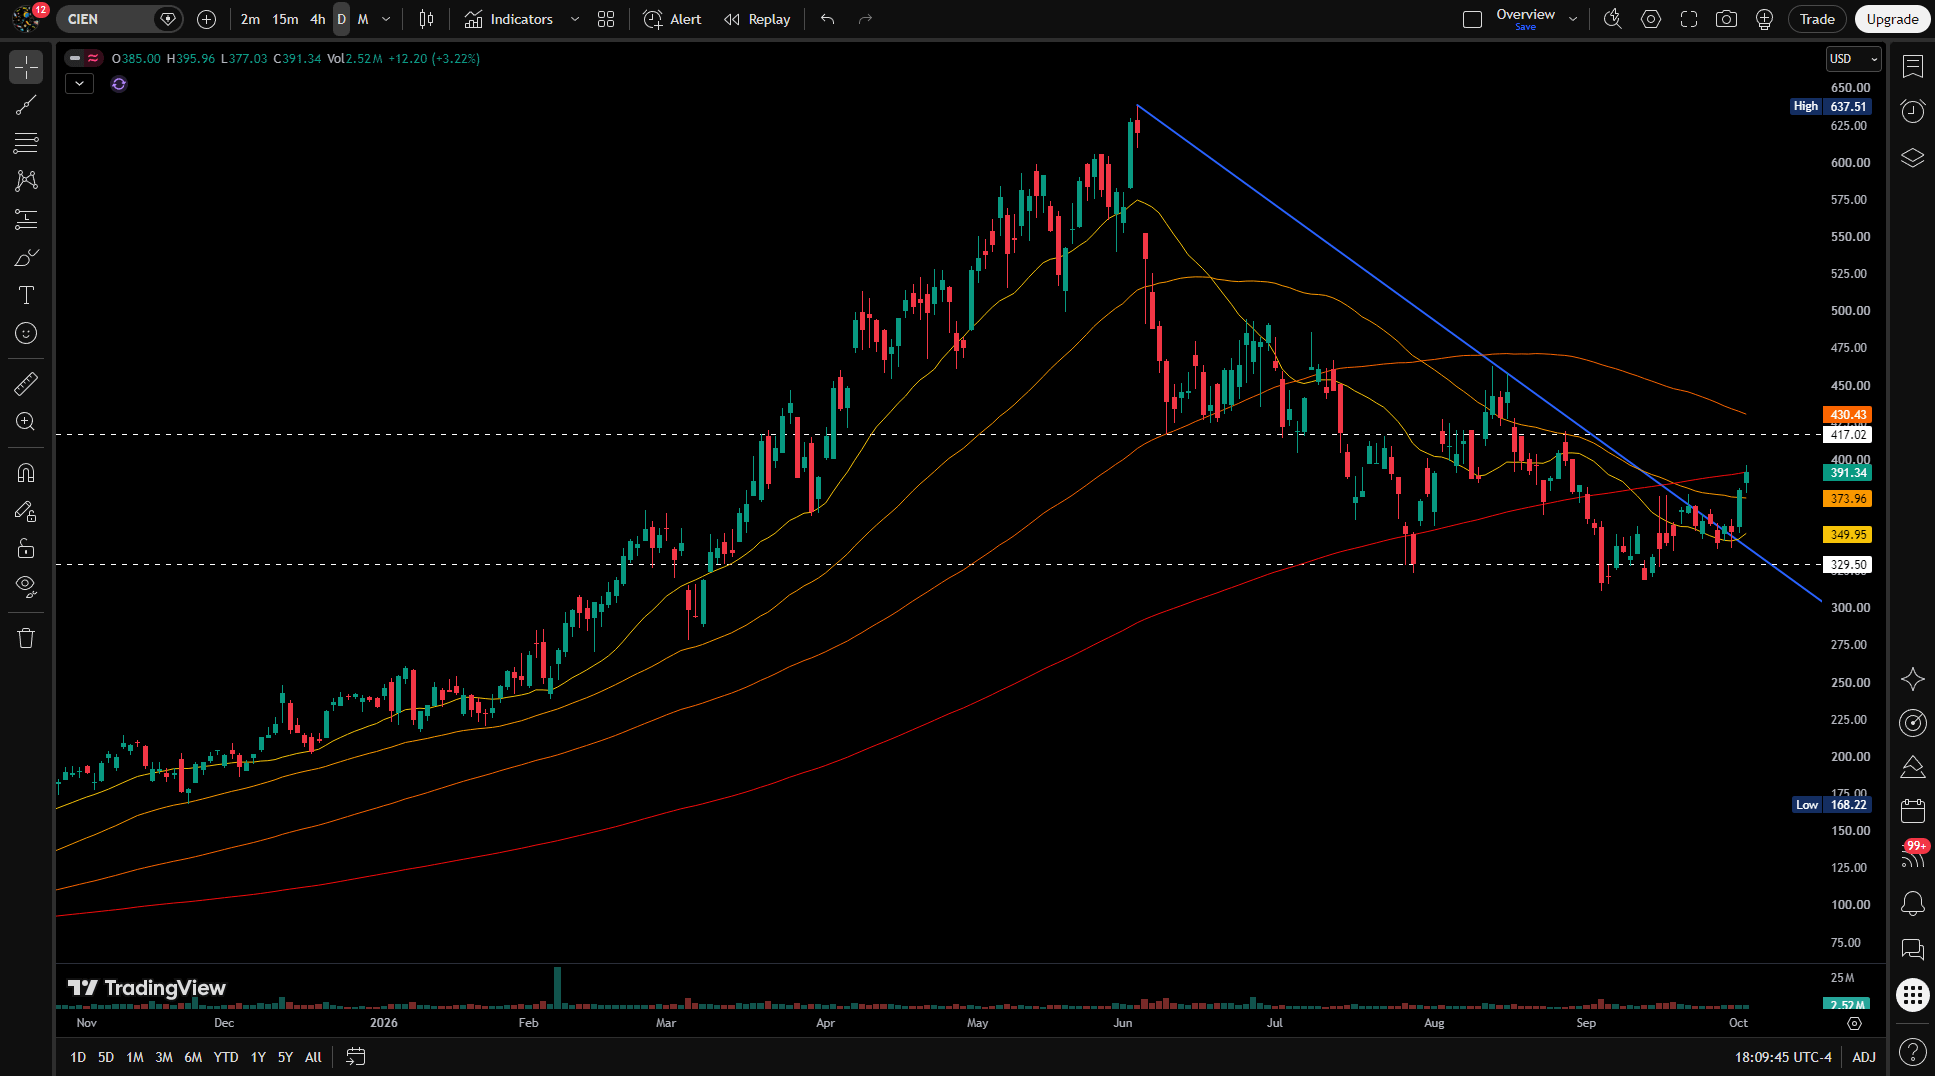
CIEN
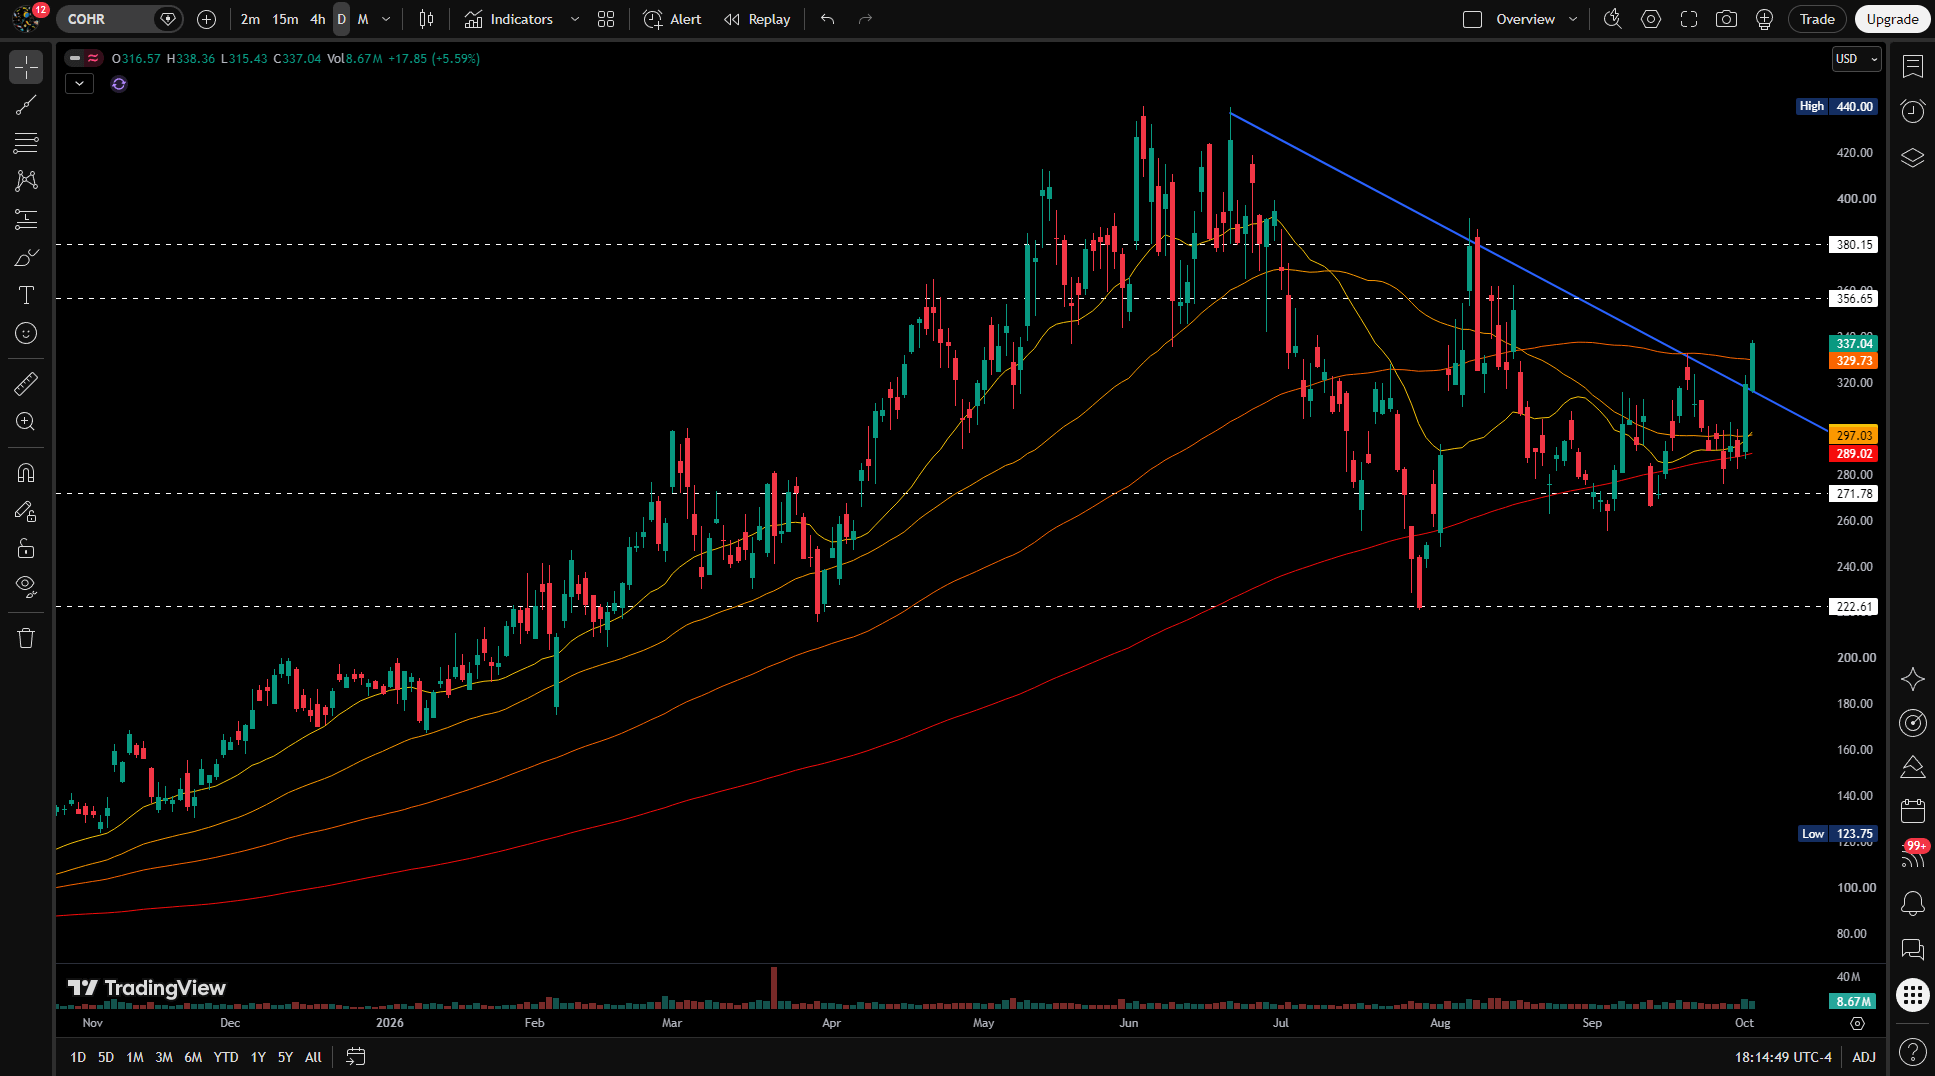
COHR
FN
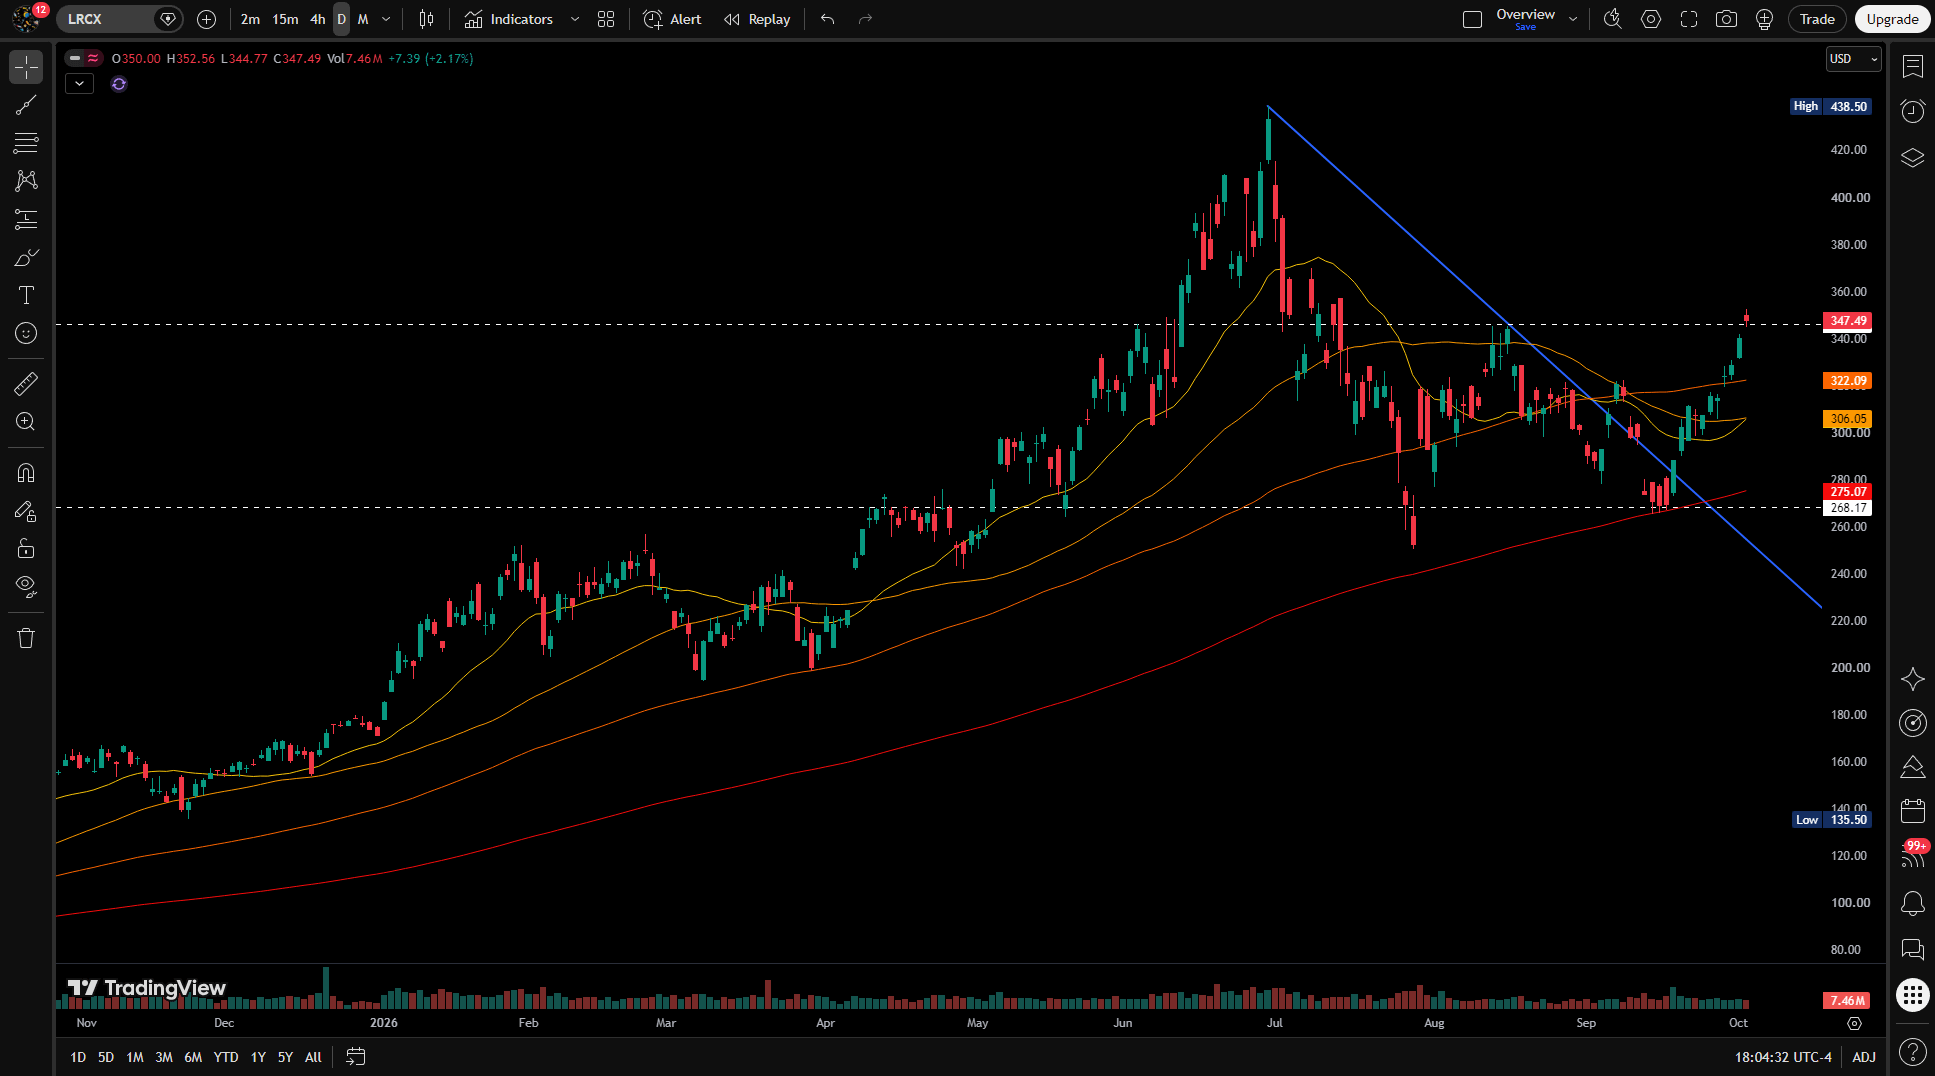
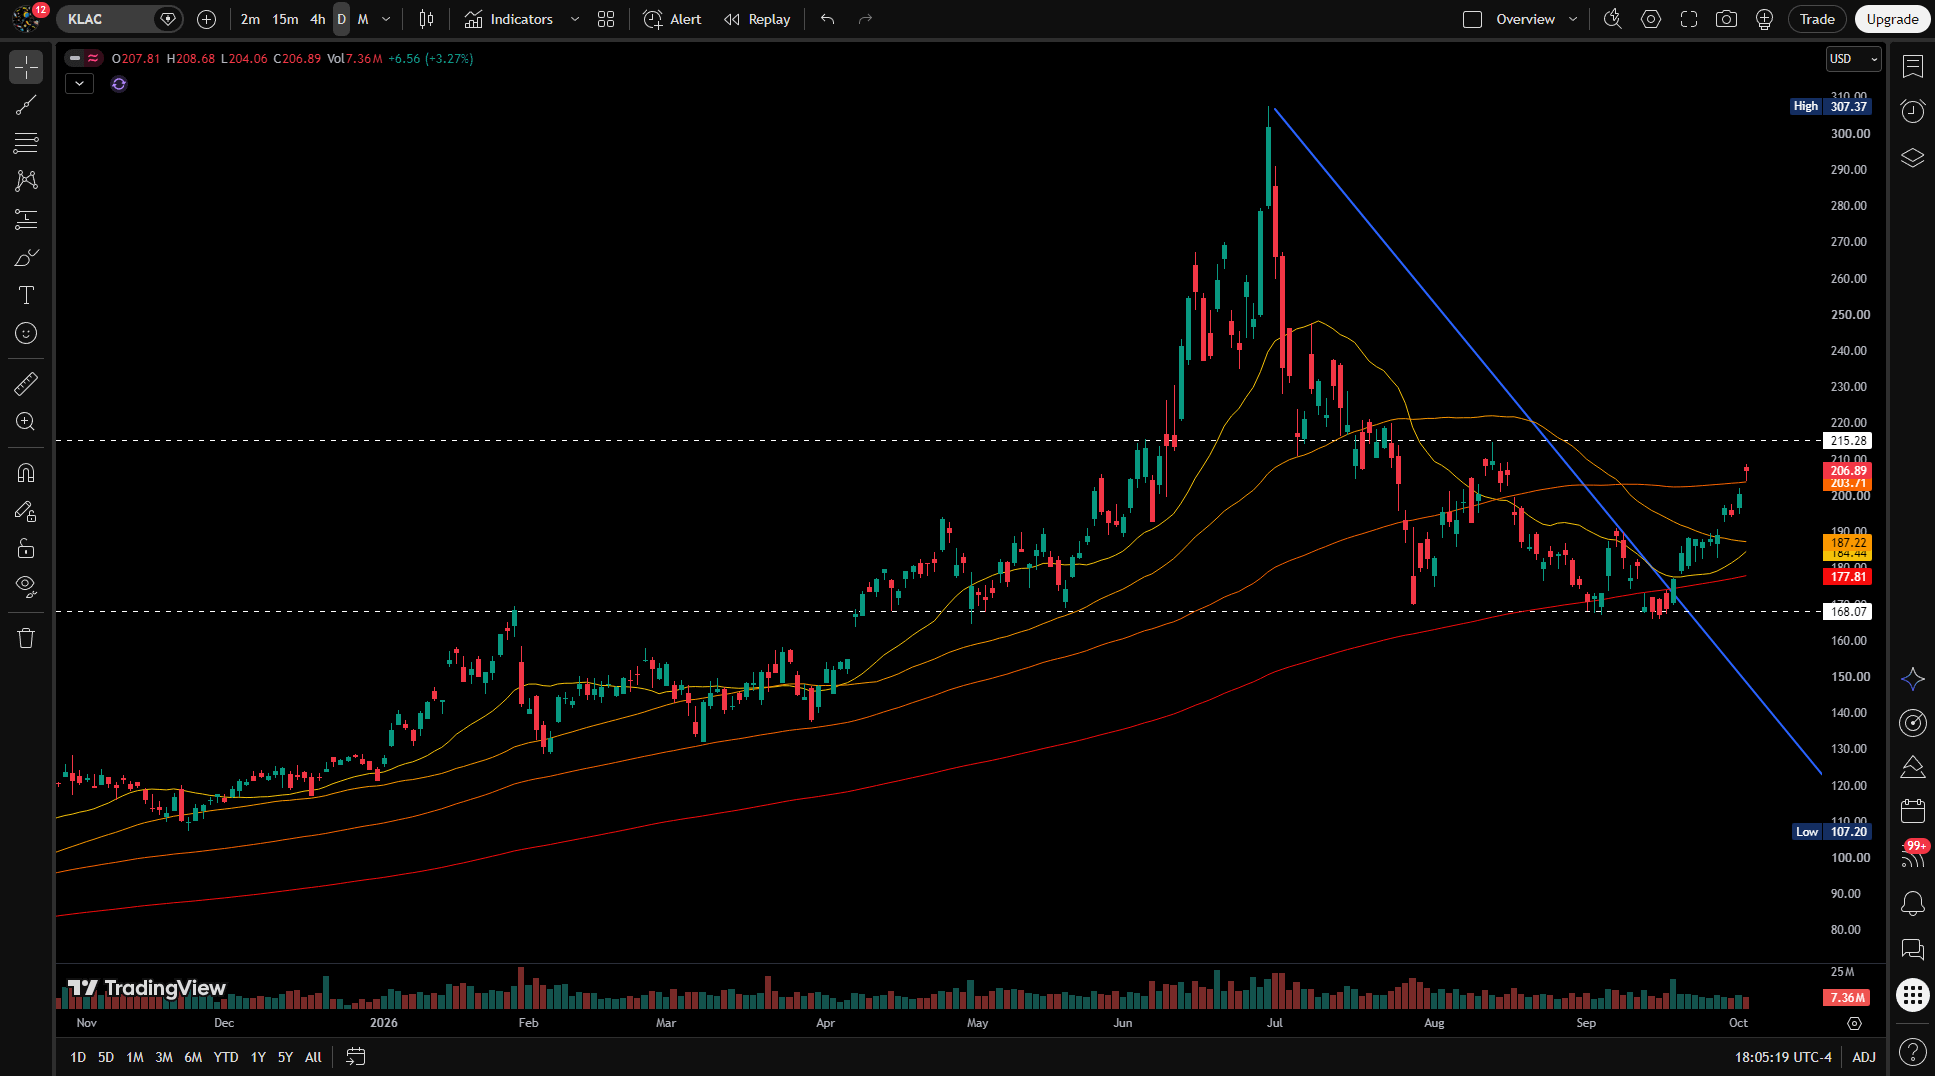
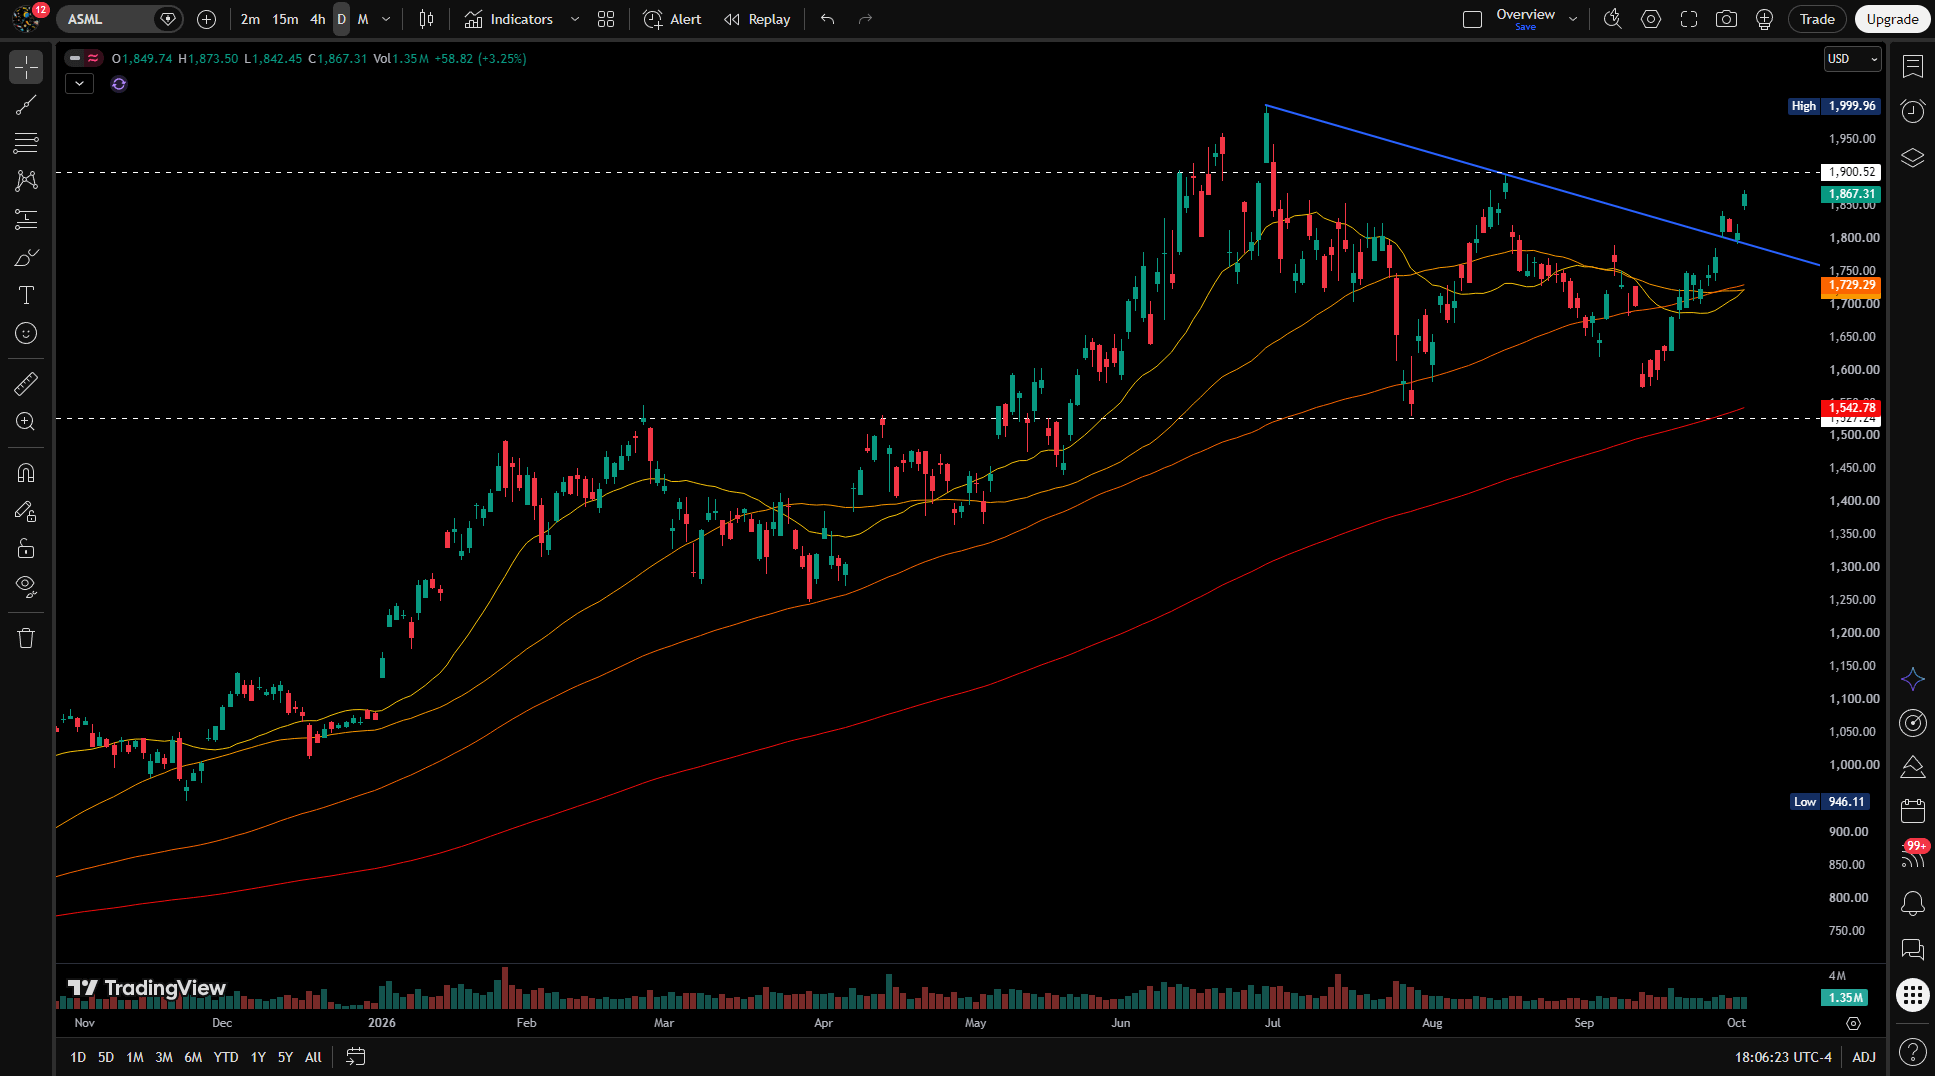
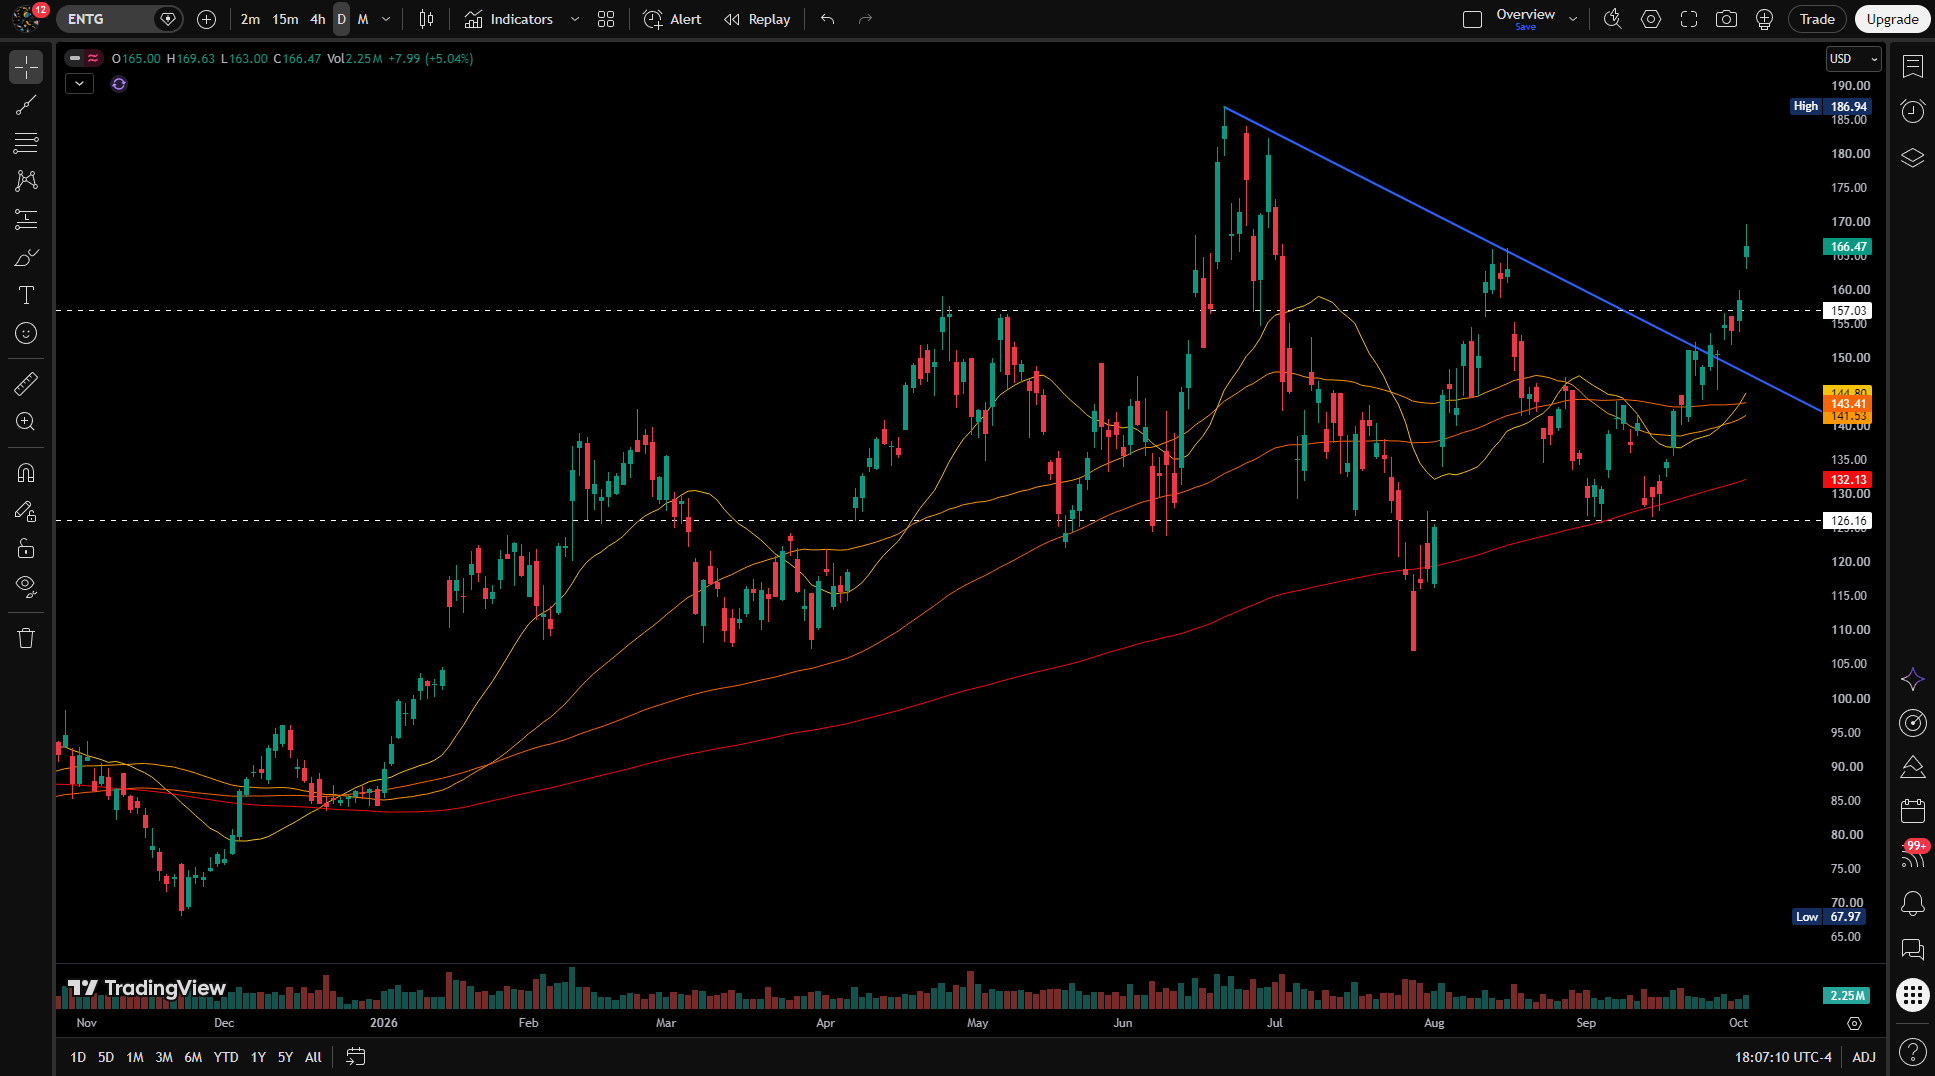
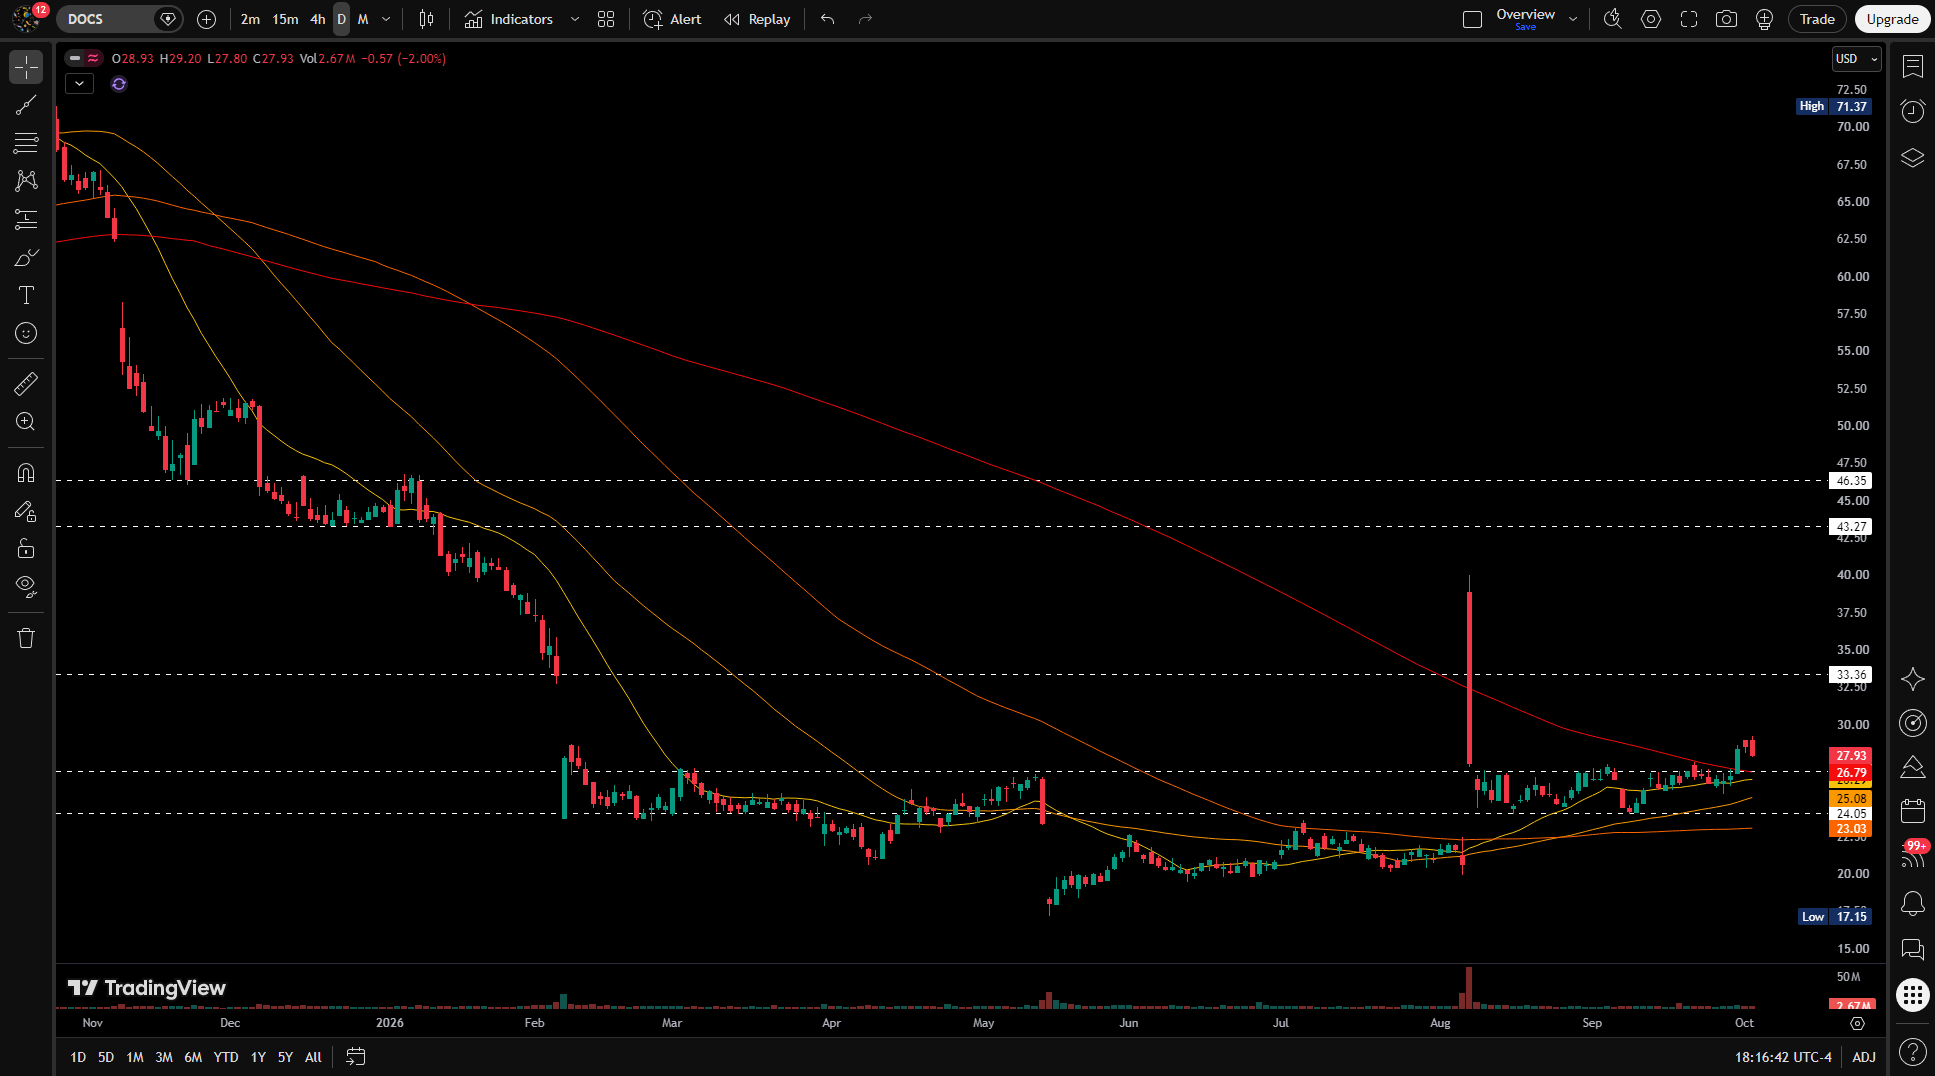
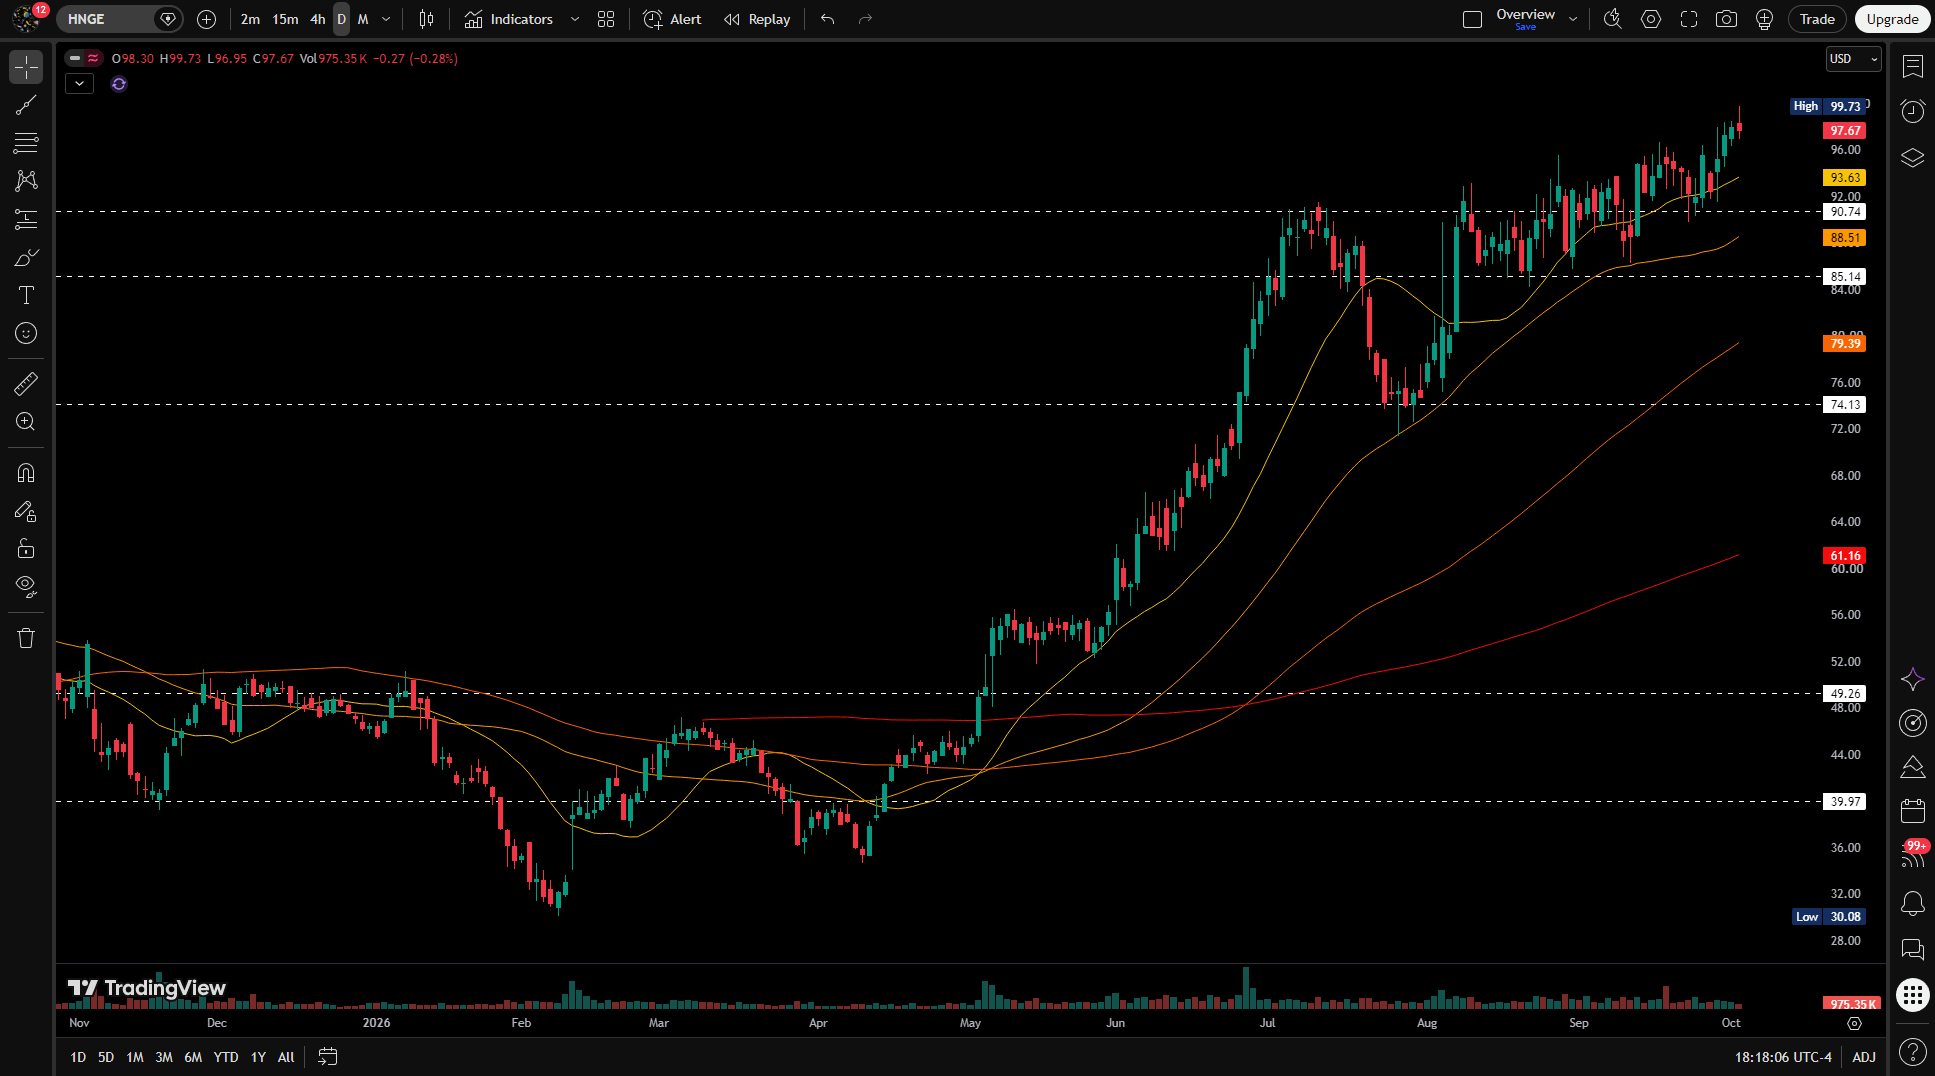
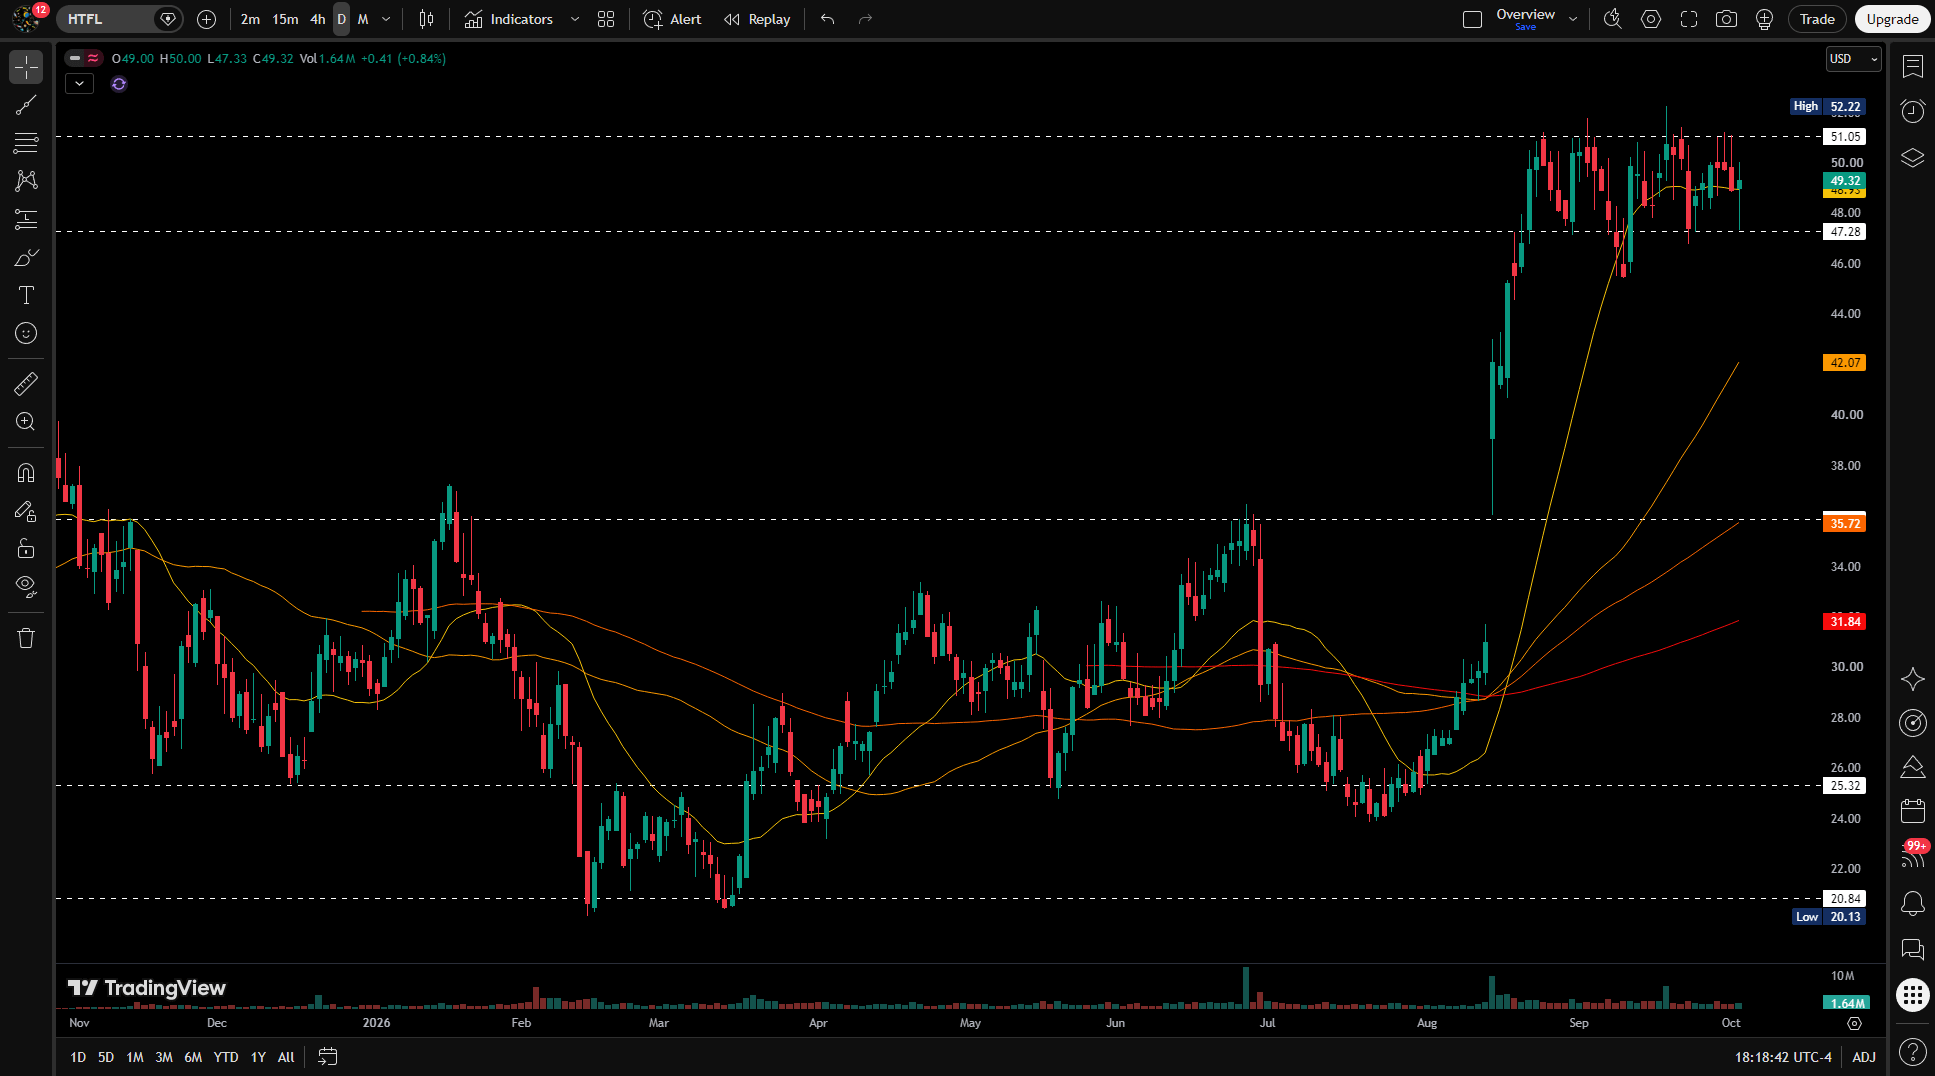
Inside a falling sector. Health Information Services ranks second out of 101, while the Healthcare sector score fell 18.8 points. That’s the classroom. Names to chart:
DOCS
HNGE
HTFL
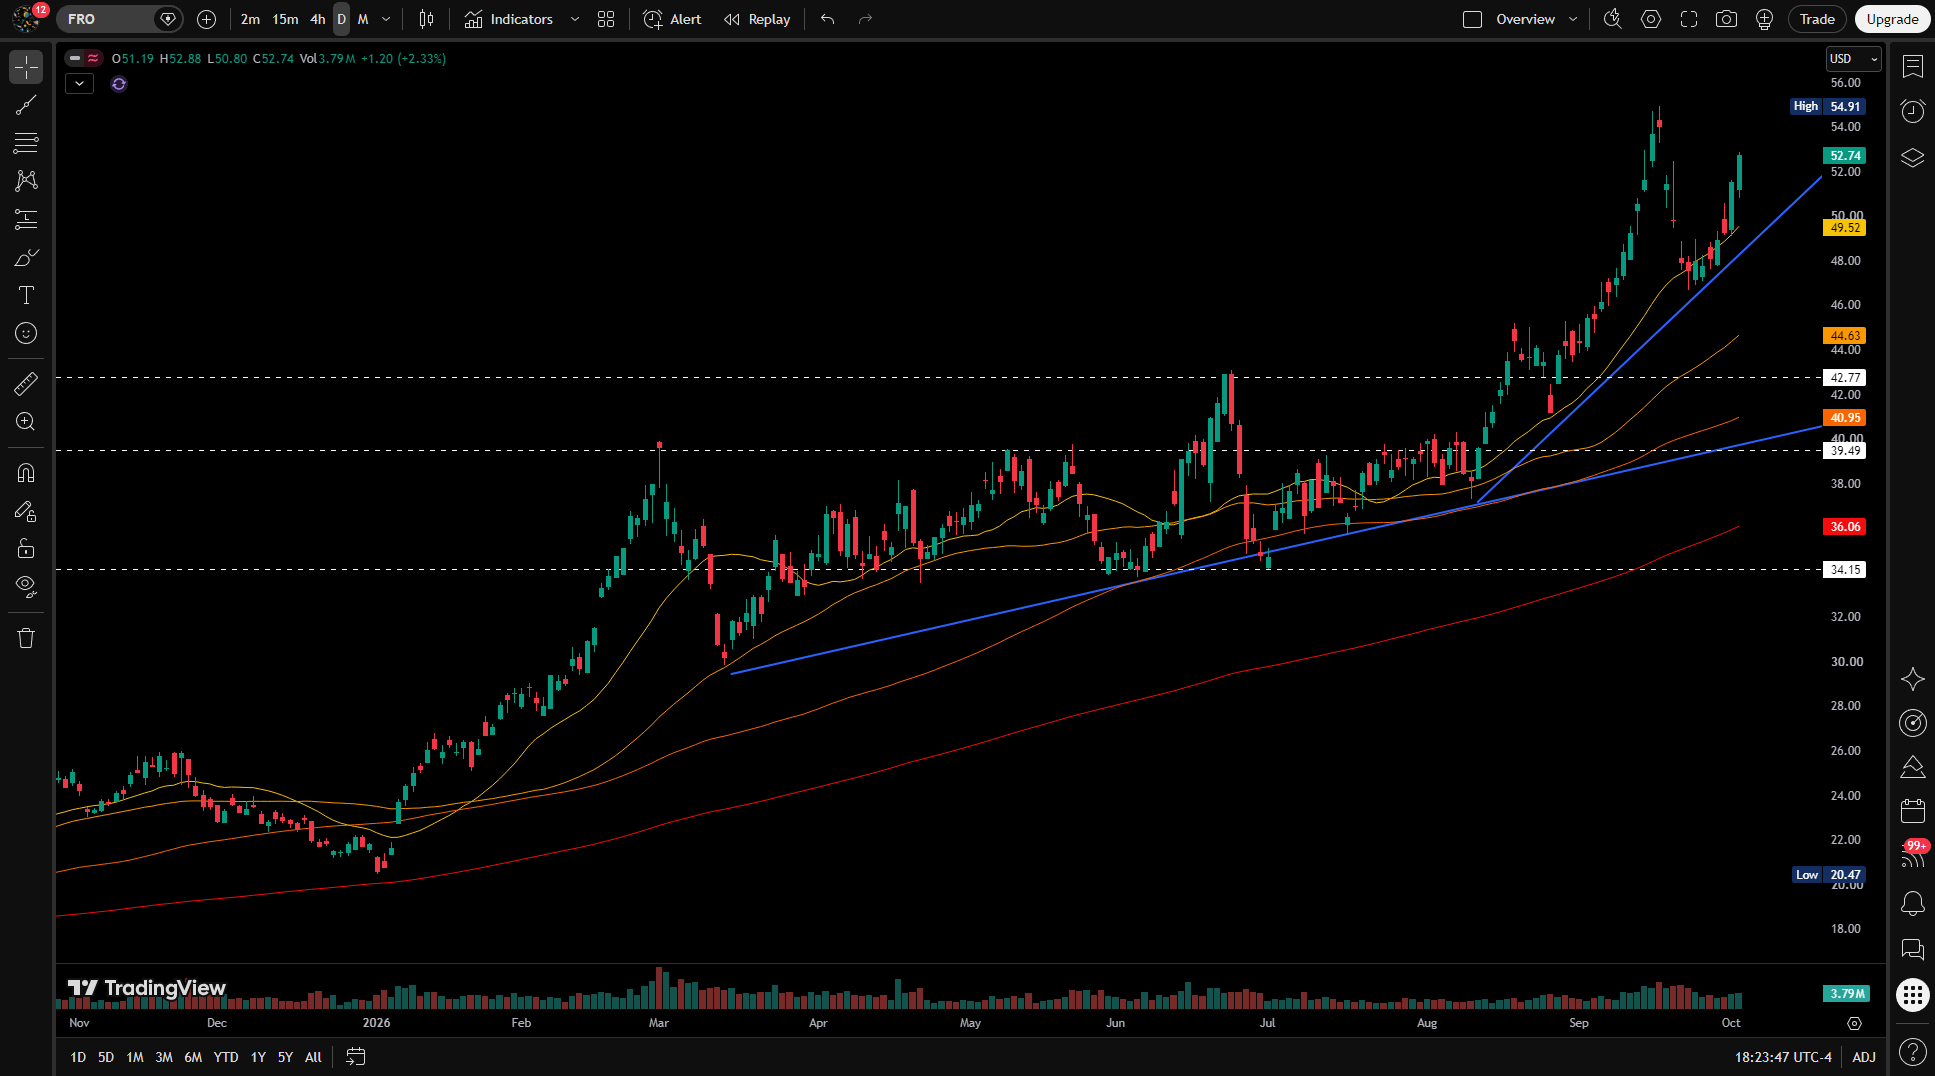
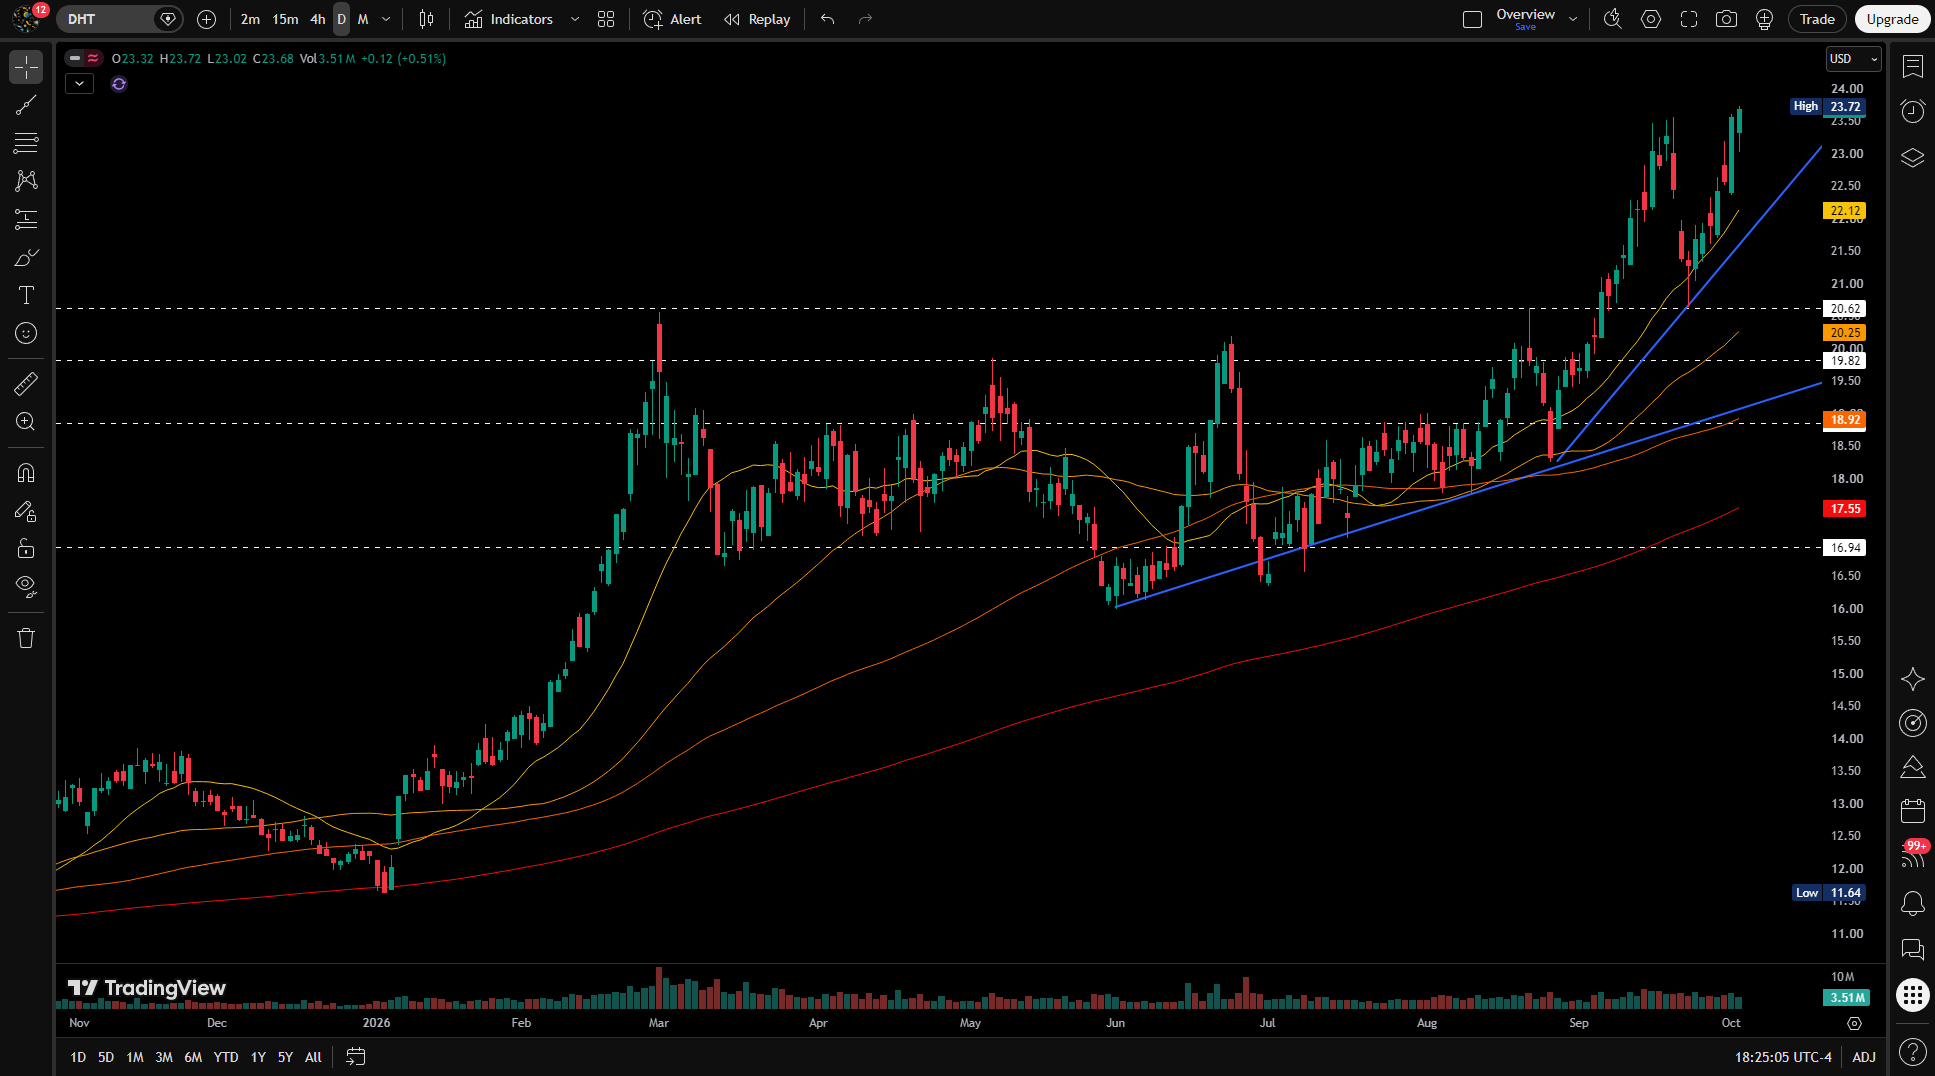
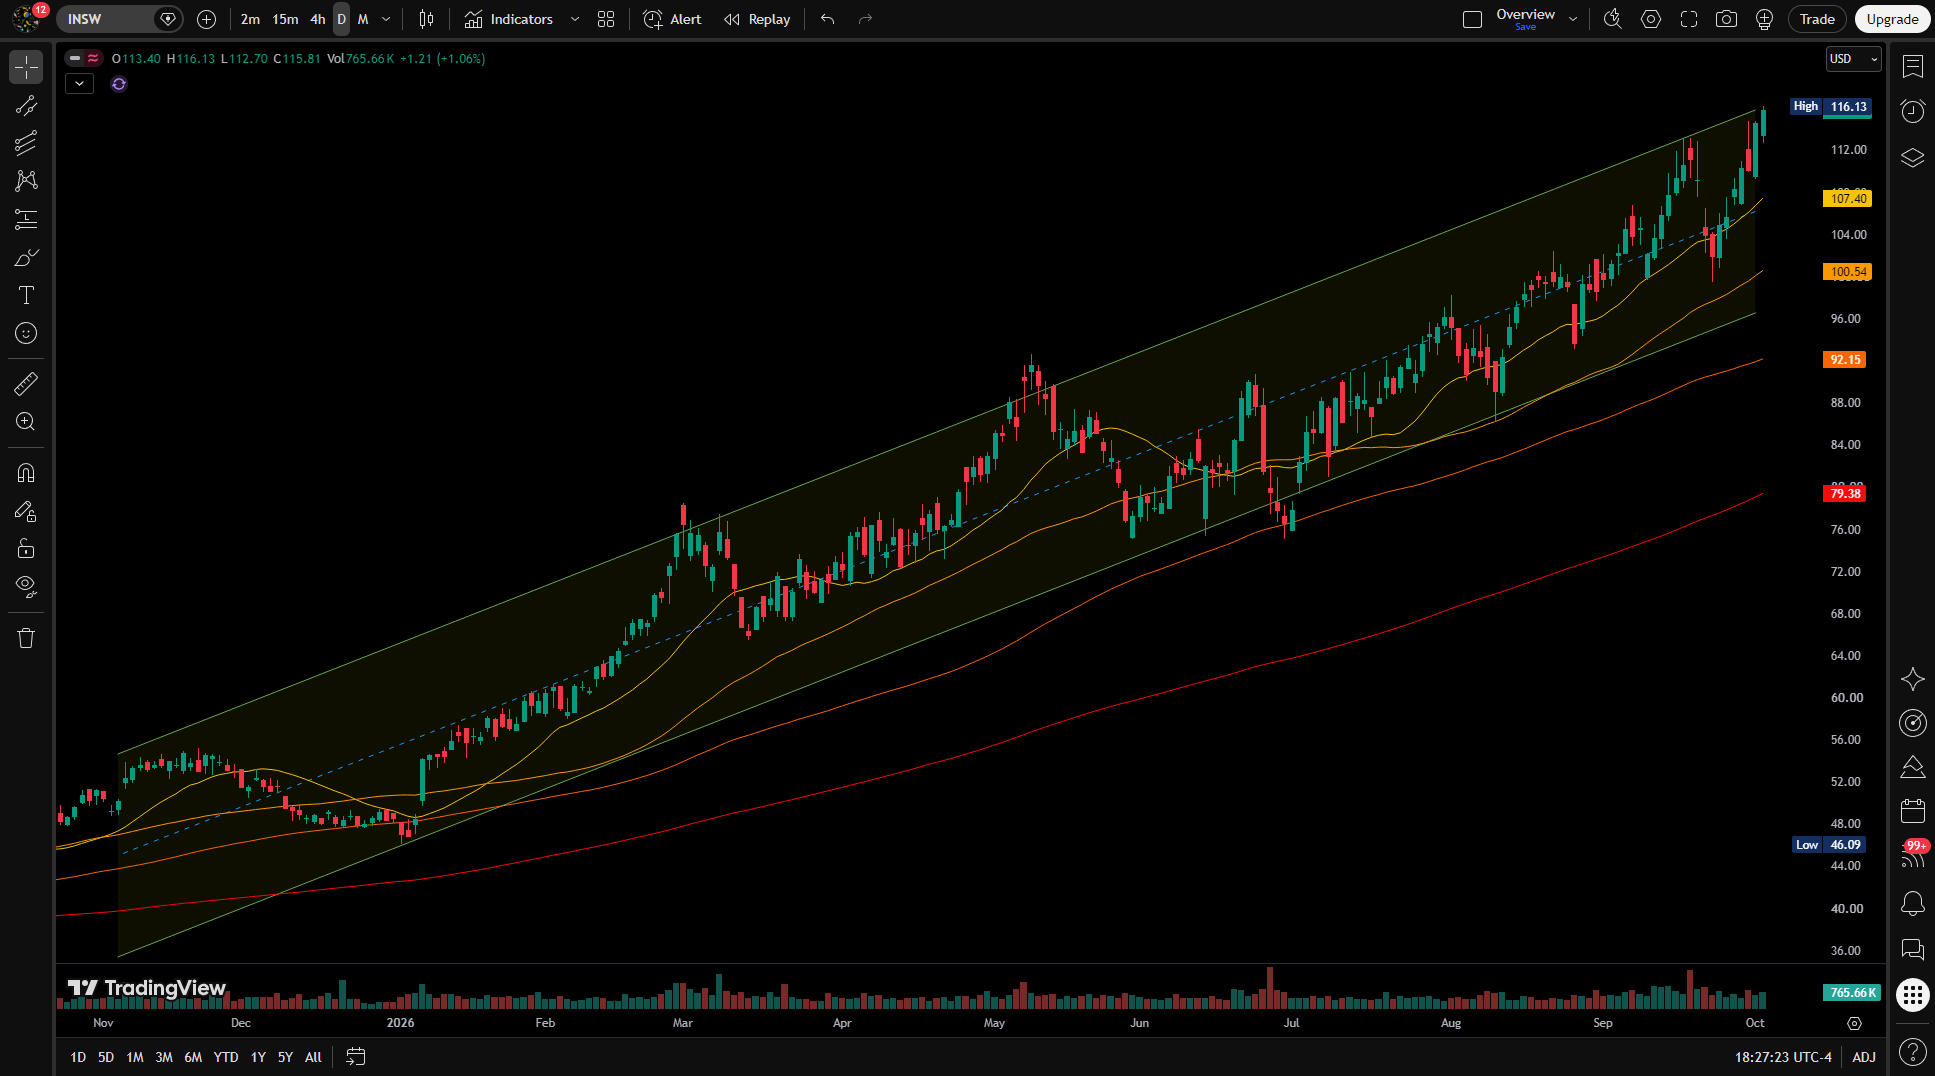
Tied to the oil story. Oil Tankers ranks sixth. Brent crude futures rose 4.45% this week while U.S. WTI futures fell 1.41%. That’s an unusually wide split, and the kind you’d expect when the worry is about Middle East supply lanes rather than U.S. supply. The tie between tankers and the Strait of Hormuz headlines is my inference, not something the dashboard says. Names to chart:
FRO
DHT
INSW
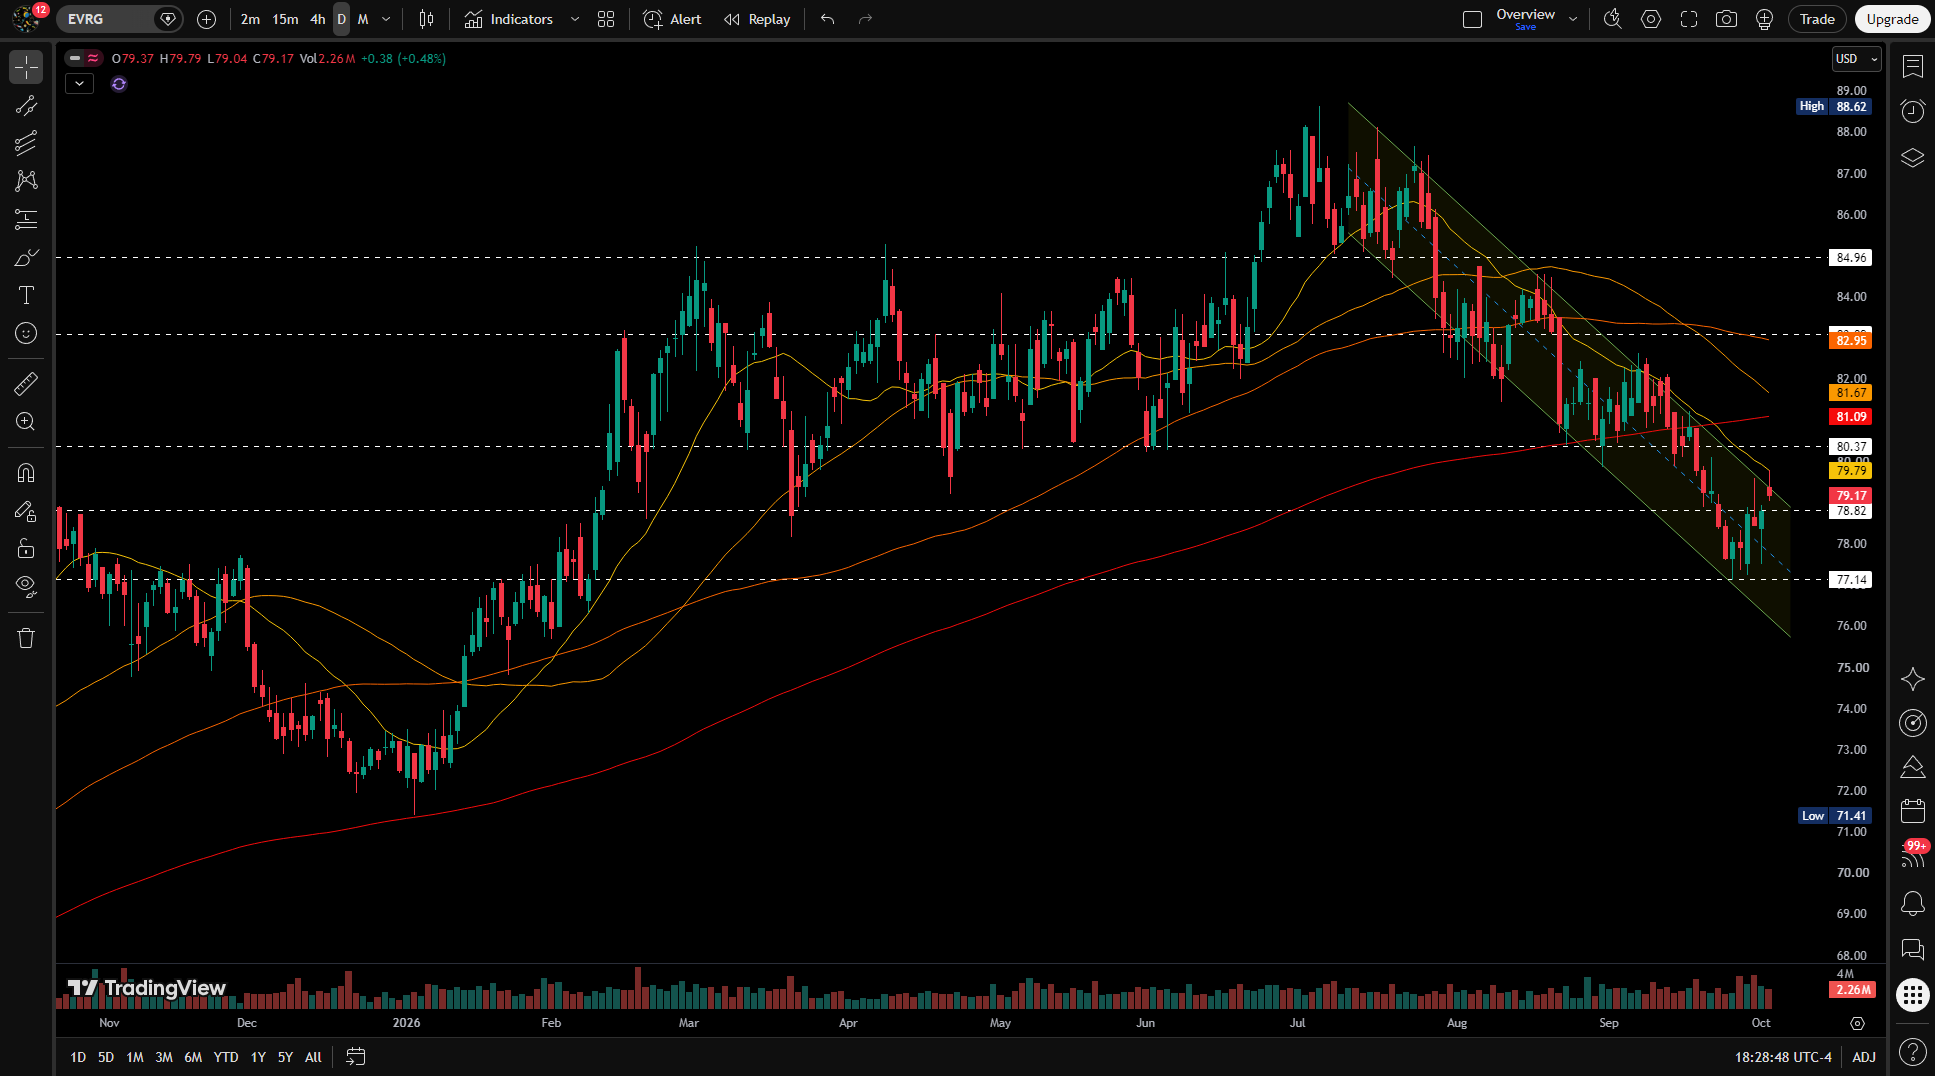
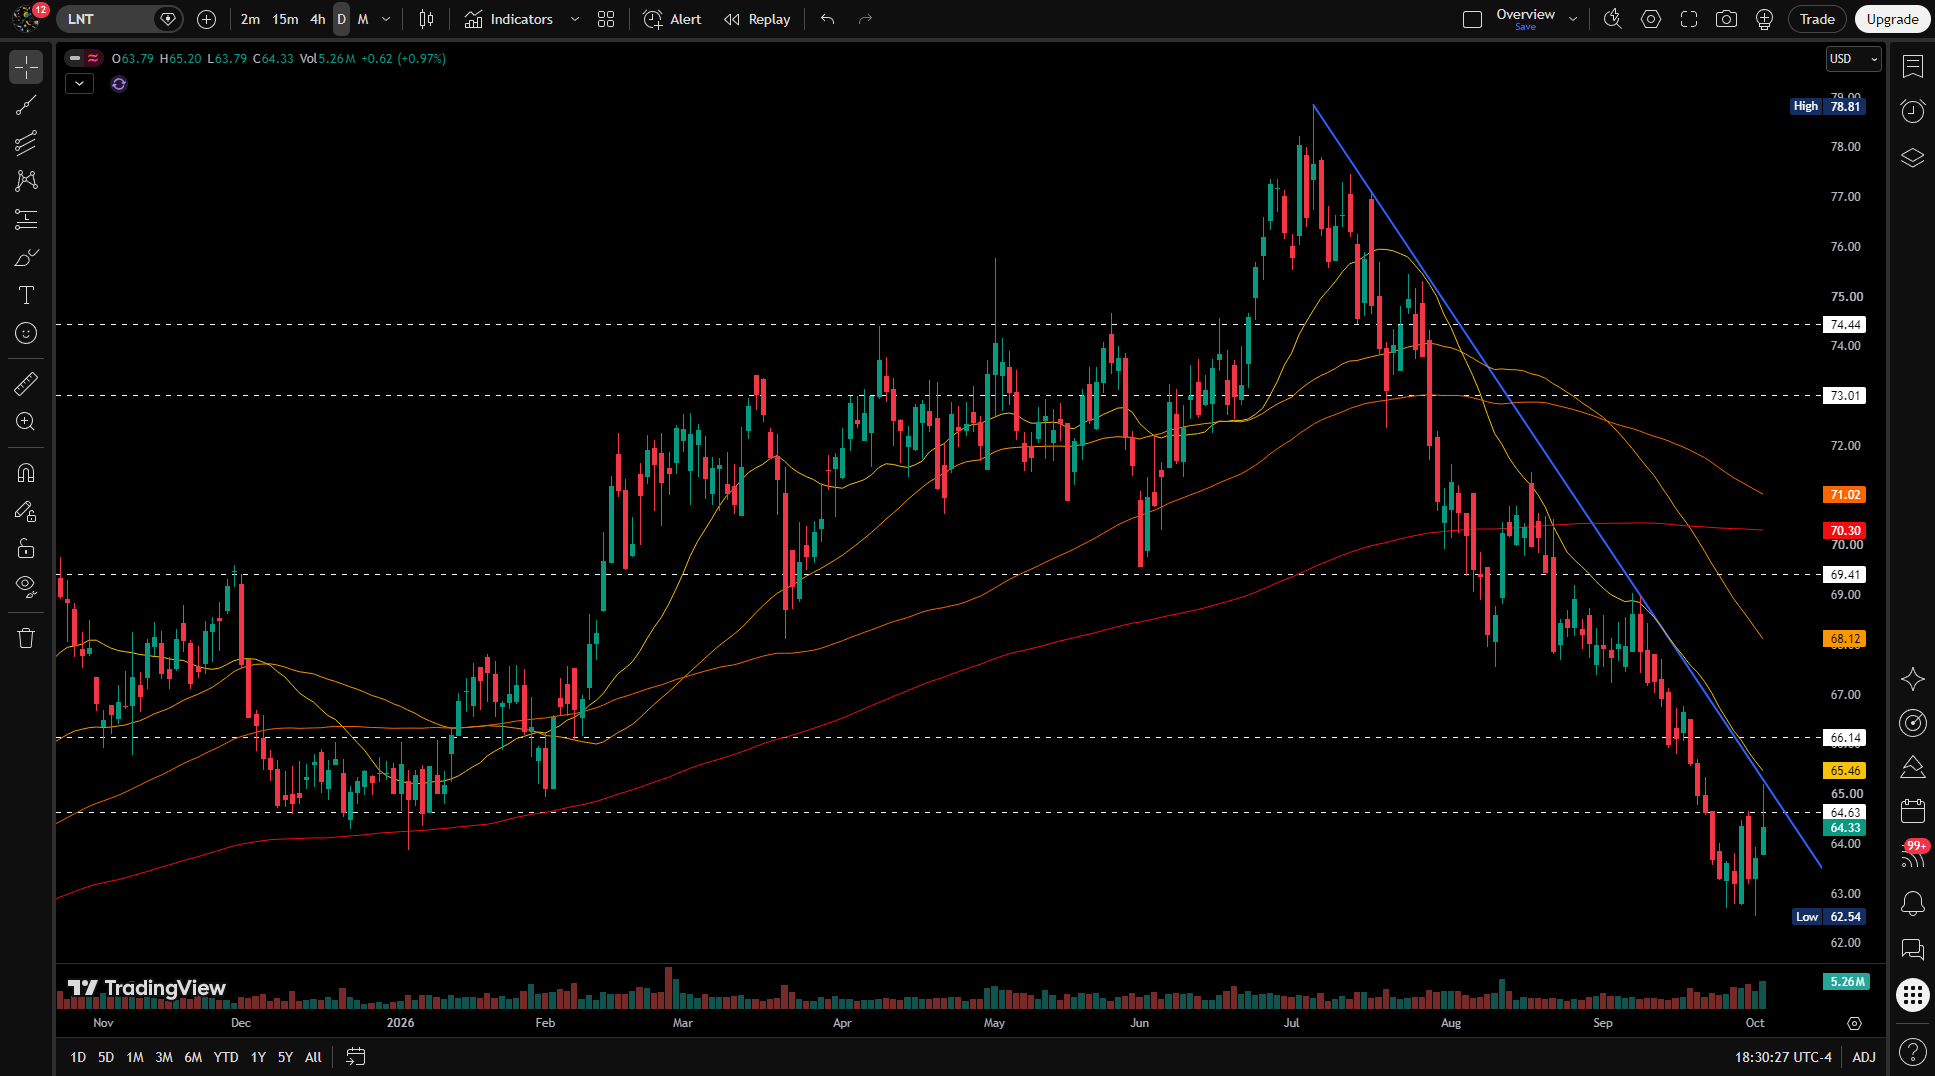
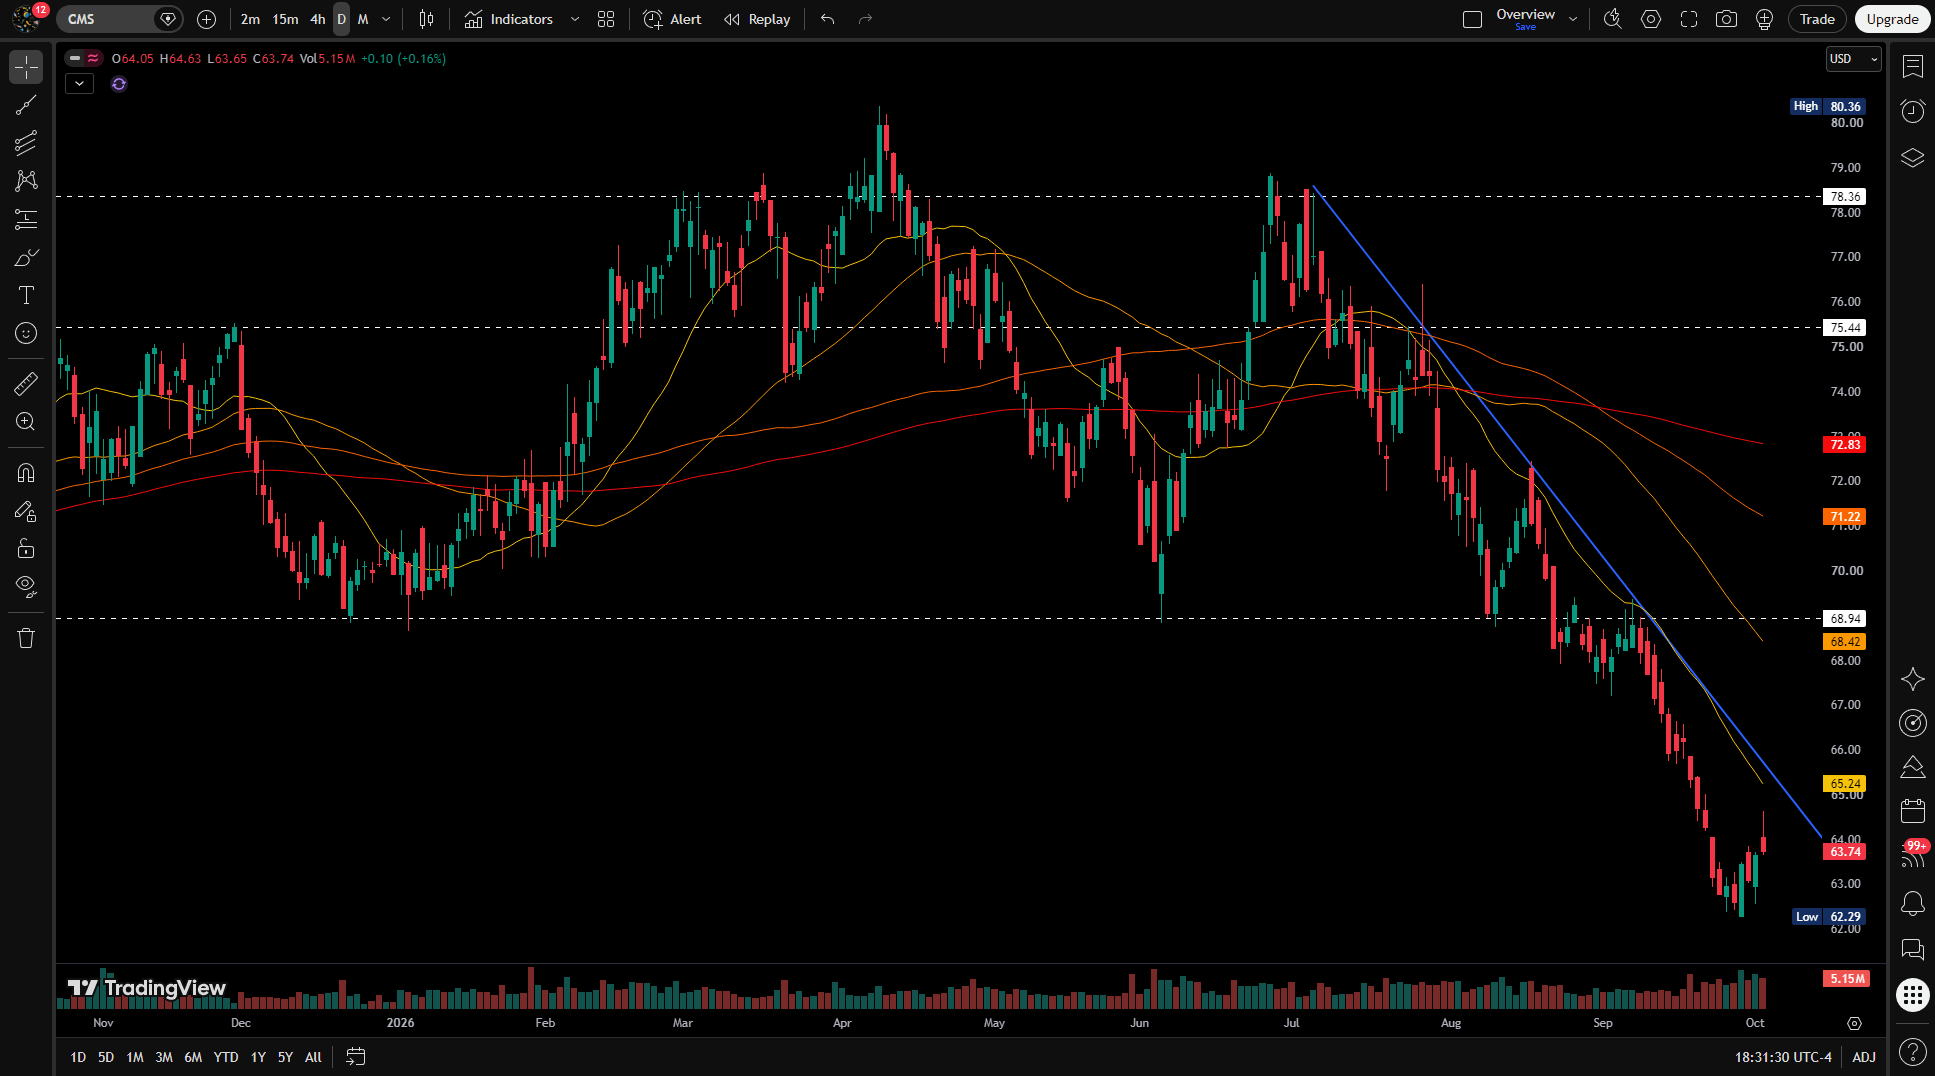
Just starting. Near the bottom of the list, which means just beginning to potentially turn, are four utility themes. That’s consistent with Friday’s 16-point Utilities jump.
EVRG
LNT
CMS
AEE
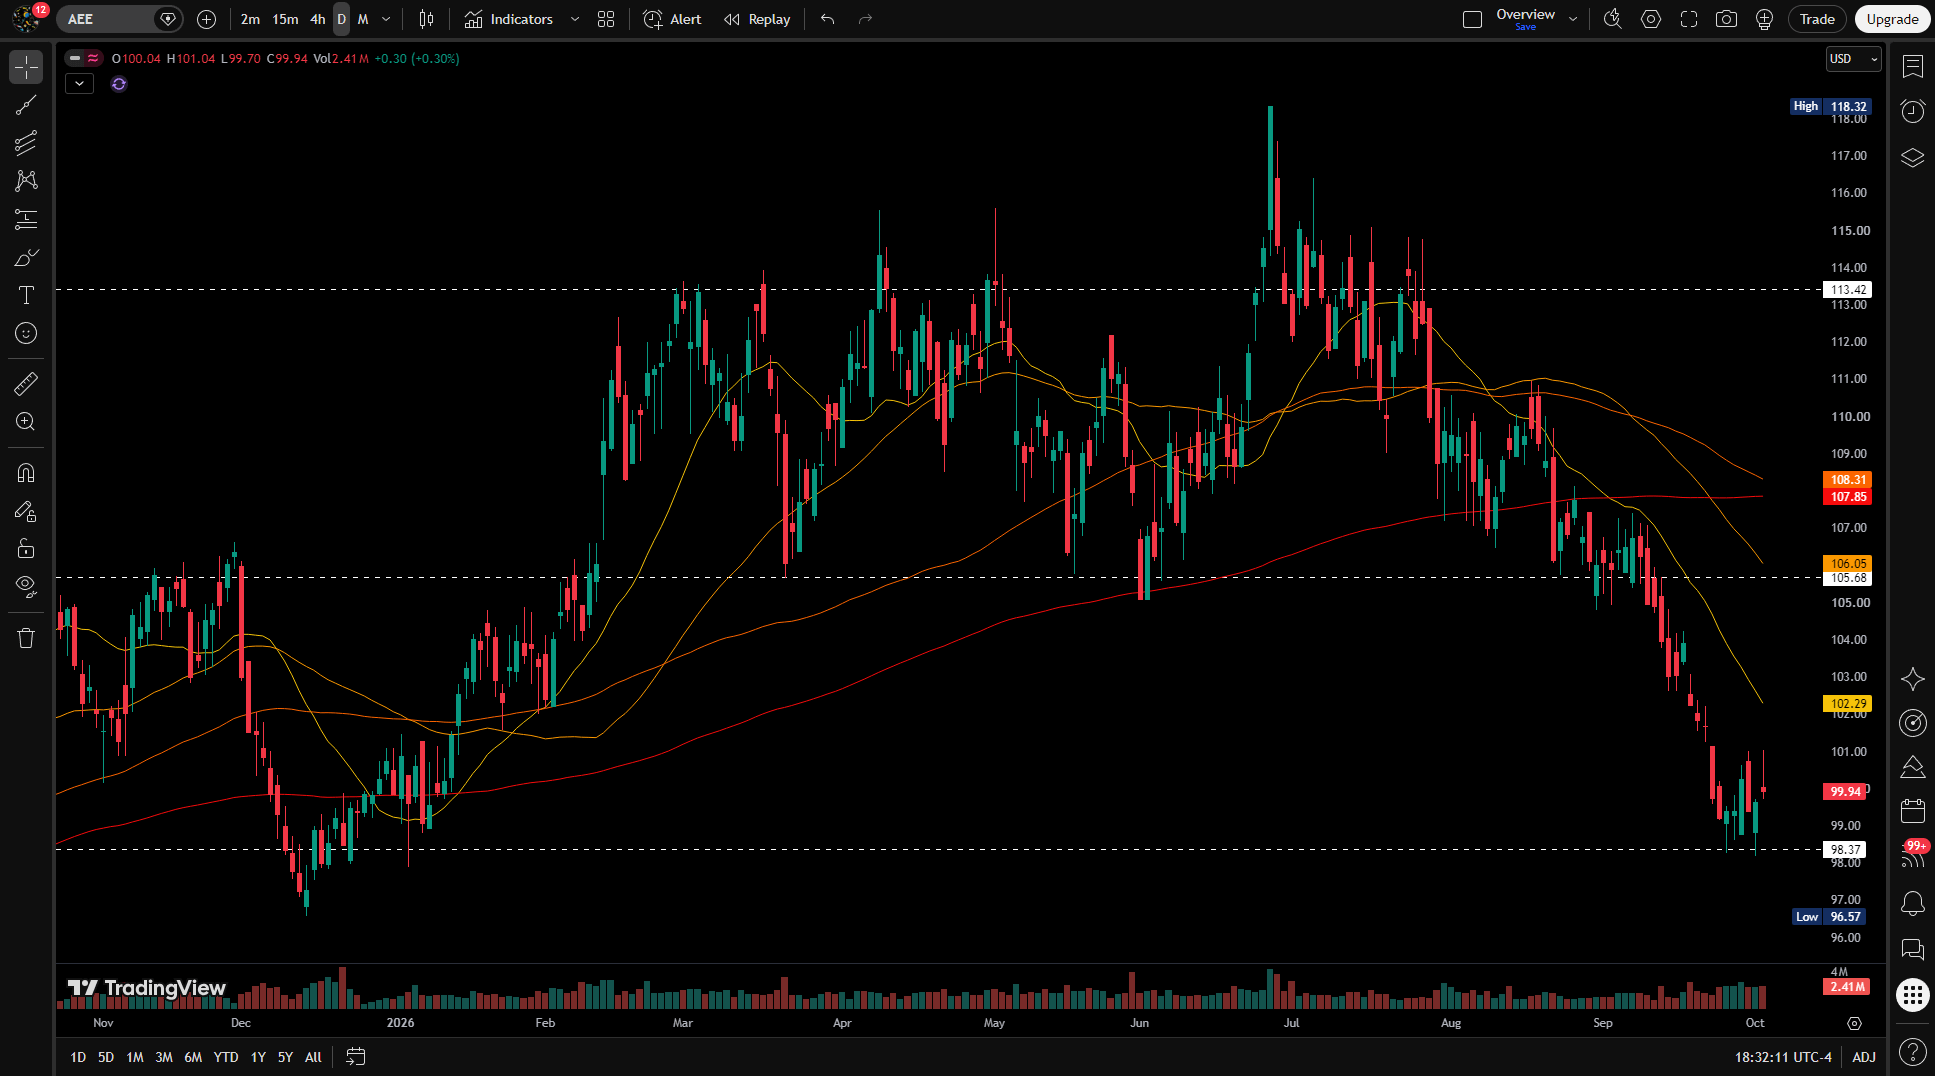
These are names to chart, not picks.
Energy and the debasement debate
Energy’s score finished the week at 29.2, roughly where it started, after dropping to 10.7 on Thursday. On the rotation graph it’s now deep in the lagging corner, completing a trip from far right to far left over about a month.
On debasement: gold futures fell 3.68%, silver fell 6.77%, and the dollar index rose 1.00%. That’s the second straight week of hard assets down and the dollar up, the opposite of a debasement trade. Two weeks is still not a trend, but the case is leaning the same way.
On deck
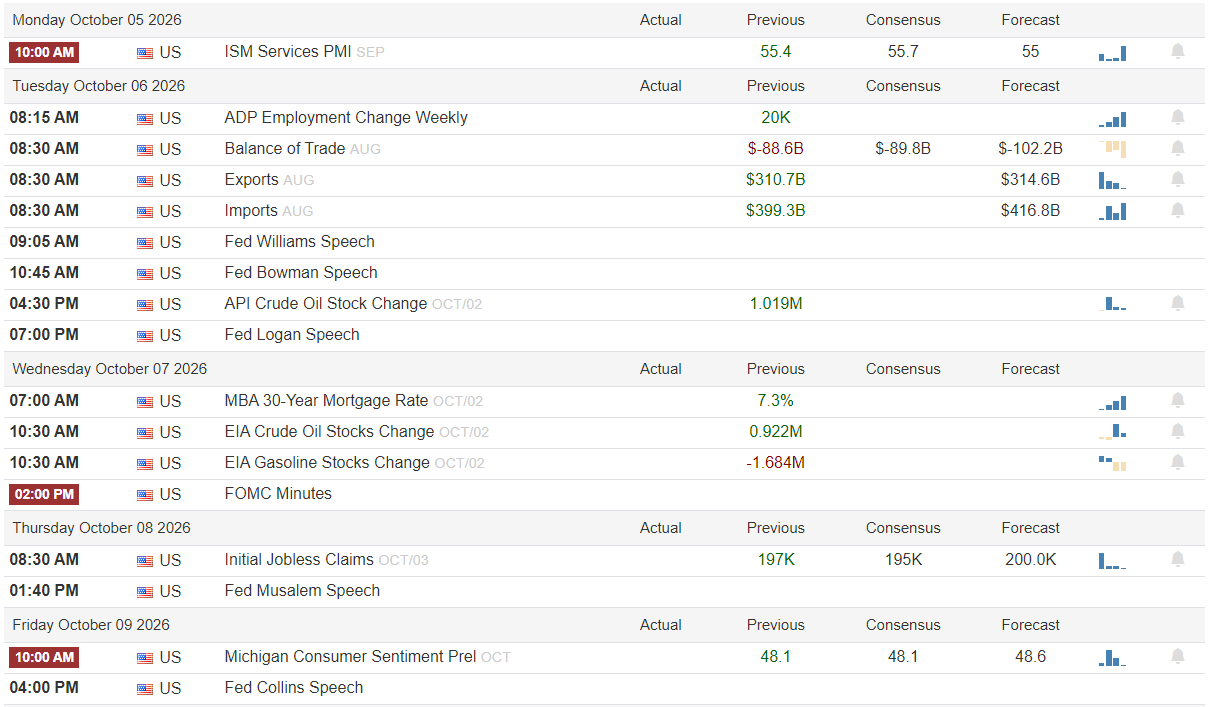
It’s a lighter week. ISM Services comes Monday. FOMC minutes come Wednesday afternoon, and they’ll be read for how many officials wanted more hikes before a 29,000-job month came in. Constellation Brands reports Tuesday after the close, PepsiCo Thursday morning, and Delta Friday morning. Delta is worth a look given where oil is. Michigan consumer sentiment comes Friday.
The thing to watch
If the sector-average score holds above 27.2 every day and closes the week above 30, Friday’s snapback becomes the start of something rather than a one-day event. If it closes any day below 23.5, that’s a third straight week of lower lows, and I’ll check volume again. Heavy volume on that day would be the crowd I’ve been waiting for. Light volume would make it three weeks of quiet erosion, and that would become the story in its own right.
What this means by your clock
If you trade on days to weeks: the S&P has spent two months between roughly 7620 and 7800, and Thursday tested the bottom of that range. Breadth is weak, and leadership is about as narrow as it gets: one sector, and mostly one corner of it. The themes list gives you specific names inside that corner. The nearer-term risk is that a market this narrow can lose its one leg.
If you invest on years: the study I keep citing says low support scores have historically been better-than-average entry points, except during real bear markets. The S&P is a quarter of a percent off where it started the week and inside a two-month range. That isn’t a bear market. One week of new lows isn’t a reason to do anything. It’s a reason to know where the floor of that range is. Protection is still dirt cheap to carry.
That’s the week. A new low, no crowd, a jobs report, and a snapback. Still unresolved and primed for a move. Thanks for reading, and see you next week.
Talk soon, Bruce
If you’re not a subscriber yet, I’d love to have you. And if you’ve got questions about VolumeLeaders itself, what the data means, how to read the dashboard, anything, just reach out. Happy to answer them directly.
This newsletter is for informational purposes only and is not investment advice. Nothing here is a recommendation to buy or sell any security. Past patterns in this data are not a guarantee of future results, a point this piece has hopefully made concrete rather than just disclaimed.
Thank you for being part of this community and for investing your time in this week’s edition. The quality of this readership — thoughtful, disciplined, engaged — is what makes this work meaningful. I’m grateful to build alongside you. Here’s to a week of clarity, conviction, and well-executed opportunities.
— VolumeLeaders